Figures & data
Figure 1. Map of Nepal showing study sites in Sunsari district.
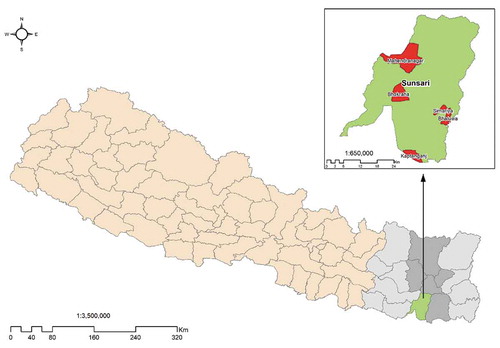
Table 1. Summary results for cereals (rice, wheat, and maize) grain yields in 2015 and 2016 in Sunsari district of Nepal
Table 2. ANOVA analysis: two way factor analysis
Table 3. Partial economics of long term trials on rice–wheat farming system (n = 18) and rice–maize farming system (n = 6) in 2015 and 2016 in Sunsari district of Nepal
Table 4. Advantages experienced with CA based practices of sampled households in 2015 and 2016 of Sunsari district (n = 60)
Figure 2. Quantity of inputs (seed and fertilizer types) used for different cereal cultivation under conventional tillage (CT), direct seeded rice (DSR), unpuddled mechanized or manually transplanted rice (UPTPR), and zero tillage (ZT) in Sunsari district of Nepal in 2015 and 2016. In figure, CT and ZT values are expressed with mean ± standard error. Recommended rate stands for the specific amount of inputs given by the Government of Nepal for that particular location.
Figure 3. Weed management cost under CT and ZT/DSR practices for rice, maize, and wheat crop in Sunsari district of Nepal in 2015 and 2016. (NRs. 103 = $1 USD).In figure, CT and ZTR values are expressed with mean ± standard error.