
Figures & data
Table 1. List of tomato lines assembled and their source
Table 2. Weather conditions during the period of the experiment
Table 3. Mean agronomic and fruit quality traits of tomato lines under HS in the poly-house
Table 4. Mean physiological parameters of tomato lines under HS in the poly-house
Table 5. Mean performance and fruit quality of tomato lines under HS field conditions (2020/21 season)
Table 6. Chlorophyll fluorescence-based photosynthetic parameters and leaf temperature of tomato lines exposed to HS in the open field
Table 7. Environmental parameters in the field and poly-house during photosynthesis data collection
Figure 1. Correlation and distribution plots of physiological and agro-morphological traits assessed during HS in the open field for the 2020/21 season. Phi2: ΦII; NPQ: non-photochemical quenching; RCC: relative chlorophyll content; LT: leaf temperature; PH: plant height; SD: stem diameter; D50F: days to 50% flowering; D50Fr: days to 50% fruiting; FL: fruit length; FW: fruit width; FY: fruit yield.
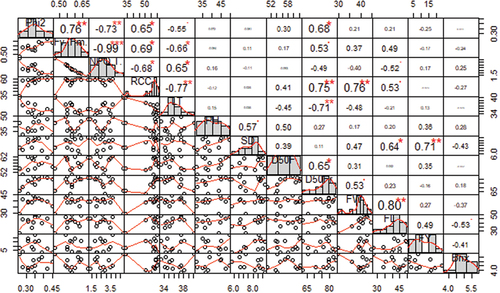
Table 8. Growth and yield components of tomato lines evaluated under HS in the open field (2021/22 season)
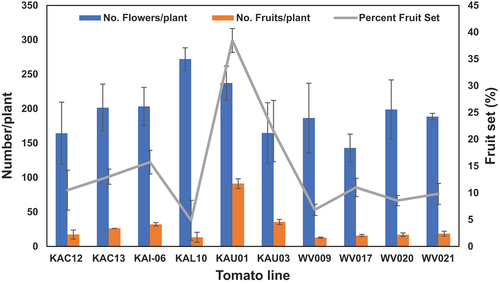
Figure 2. Number of flowers and fruits per plant and percent fruit set of tomato lines grown under HS conditions in the open field (2021/22 season). Error bars are represent means ± 1 S.E.
Data availability statement
The data analyzed during the current study are available from the corresponding author on rational request.