Figures & data
Figure 1. Map showing the location of the study area in Europe, Germany in white and the Federal State of Baden-Württemberg in southwest Germany in dark blue.
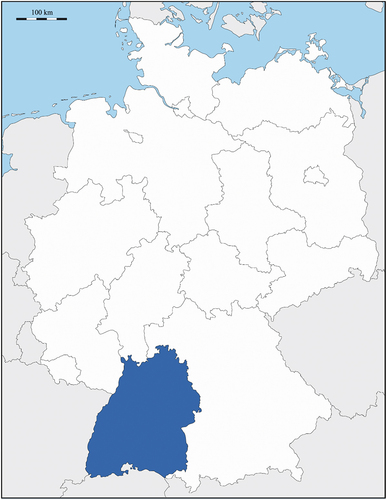
Figure 2. Experimental setup and location of KraichgauKorn farmland and organic farm site areas studied in southwest Germany. Agrobiodiversity (selected 80 wild arable species from state-wide biodiversity monitoring) and potential vulnerability of wild plant species from arable fields on landscape scale (resolution of 25 km2) is shown as background information (grey-scale). Boxplots indicate that landscape-level diversity measures are not different, hence, allowing direct comparisons of monitoring results on local fields (see Figure ).
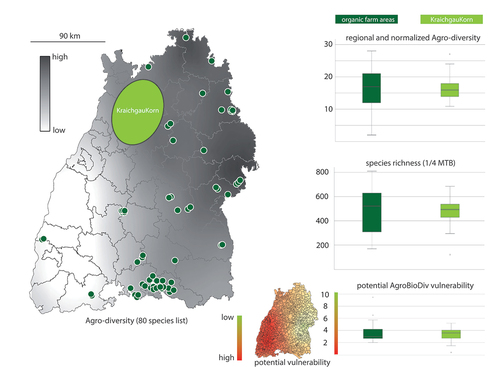
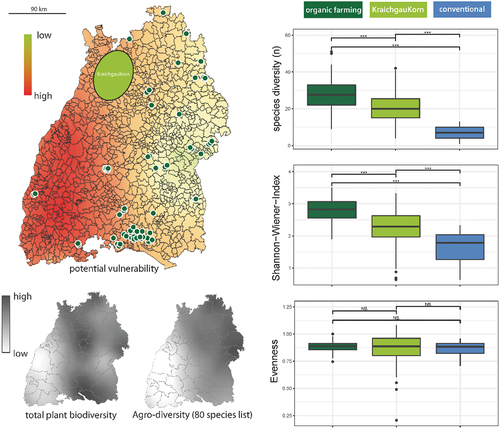
Figure 3. Field monitoring results comparing arable field plant biodiversity from organically managed sites, KGK farmland and conventional agriculture. State-wide vascular plant diversity and agrobiodiversity (80 species list) is provided as maps on ¼ MTB resolution (grey scale). Study sites are indicated with dark green circles (organic farming) and pale green area (KGK).