
Figures & data
Table 1. Information across beta-agonist free, hygienic, and natural swine farming methods
Figure 1. The histology presenting thickness of mucosa layer of swine’s stomachs in various regions including fundus, body, antrum, and pylorus of natural, beta-agonist free, and hygienic swine. Determined by scanning objective of 2.5× of microscope.
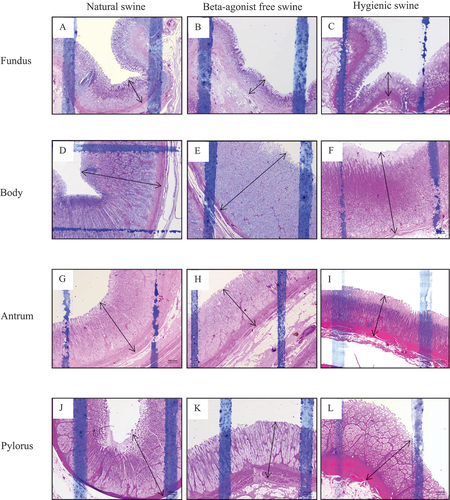
Figure 2. The histology presenting thickness of submucosa layer of swine’s stomachs in various regions including fundus, body, antrum, and pylorus of natural, beta-agonist free, and hygienic swine. Determined by scanning objective of 2.5× of microscope.
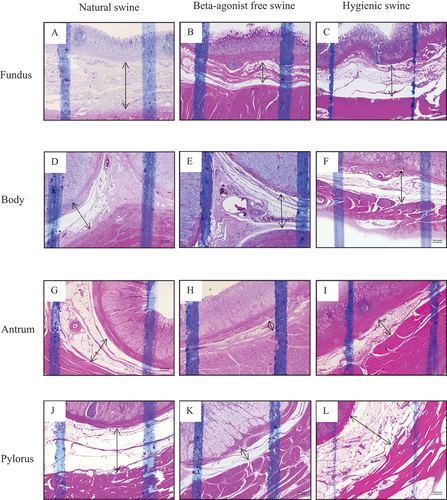
Figure 3. The histology presenting thickness of muscularis layer of swine’s stomachs in various regions including fundus, body, antrum, and pylorus of natural, beta-agonist free, and hygienic swine. Determined by scanning objective of 2.5× of microscope.
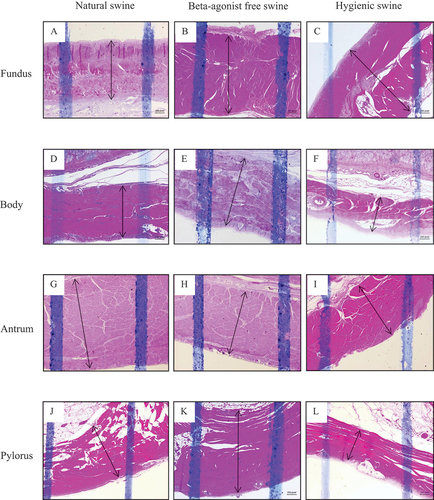
Figure 4. Histology of gastric glands in mucosa layer of swine’s stomachs in various regions including fundus, body, antrum, and pylorus of natural, beta-agonist free, and hygienic swine. Determined by scanning objective of 10× of microscope.
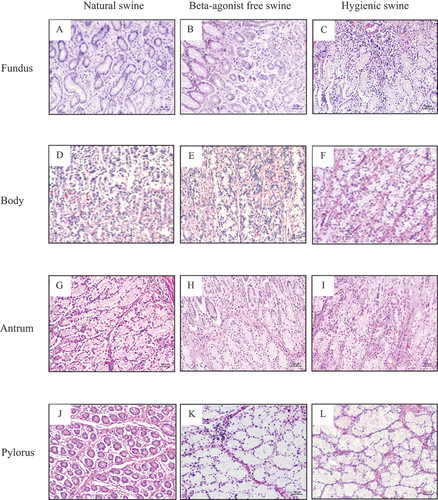
Figure 5. Morphology indicating inflammatory cells indicated as red circle and red blood cells indicated as black arrow in mucosa layer of swine’s stomachs in various regions including fundus, body, antrum, and pylorus of natural, beta-agonist free, and hygienic swine. Determined by scanning objective of 40x of microscope.
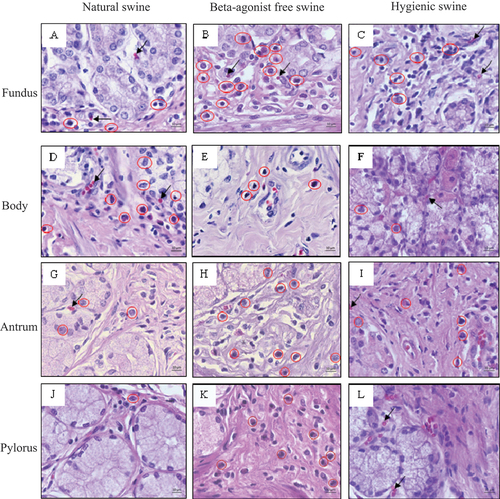
Figure 6. Morphology indicating inflammatory cells indicated as red circle and red blood cells indicated as black arrow in submucosa layer of swine’s stomachs in various regions including fundus, body, antrum, and pylorus of natural, beta-agonist free, and hygienic swine. Determined by scanning objective of 40x of microscope.
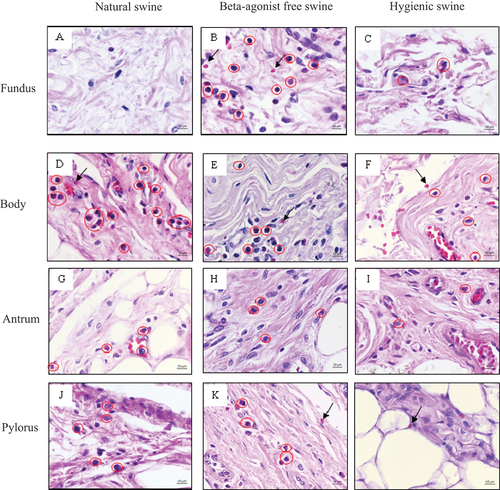
Figure 7. Comparisons of the thickness of fundus, body, antrum, and pylorus regions on mucosa, submucosa, and muscularis layers in swine. Comparisons of number of inflammatory and red blood cells in fundus, body, antrum, and pylorus regions on mucosa and submucosa layers in swine. Data are presented as mean ± S.D. **p < 0.01, ***p < 0.01, #p < 0.05, ##p < 0.01, ###p < 0.001
Data availability statement
The datasets used and/or analysed during the current study are available from the corresponding author on reasonable request http://dx.doi.org/10.1080/23311932.2023.2208248.