
Figures & data
Figure 1. Location map of the study area.
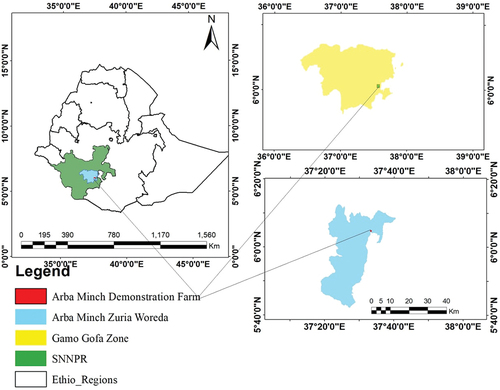
Figure 2. Climate data of the study area.
Figure 3. Layout of experimental field.
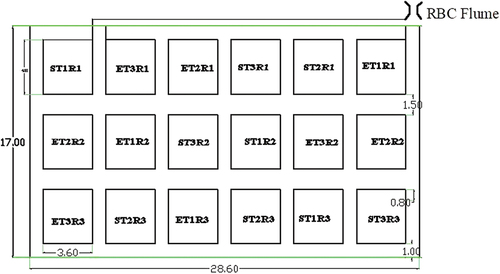
Figure 4. Soil infiltration test carried out in the field.
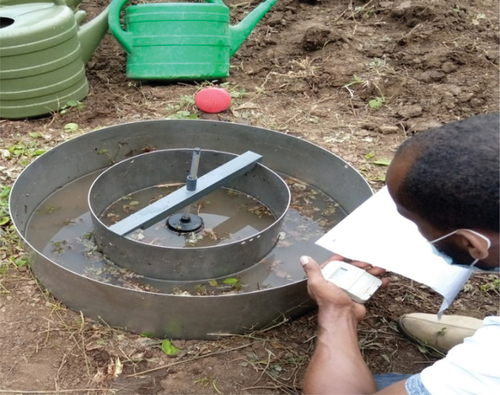
Figure 5. Infiltration test graph.
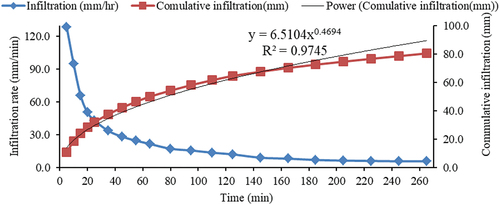
Table 1. Treatments and levels of application
Figure 6. RBC flume and b) discharge measurement.
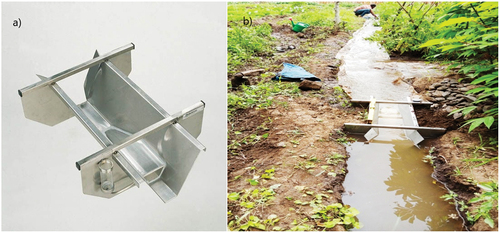
Figure 7. The relationship between RBC flume discharge (l/sec) and head (mm).
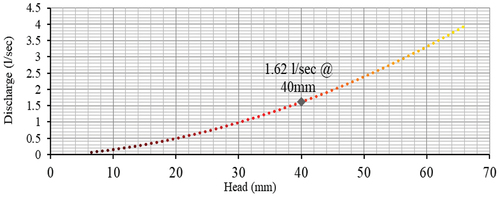
Table 2. Soil properties of the area
Table 3. Irrigation schedules
Figure 8. SM variations in scheduling methods.
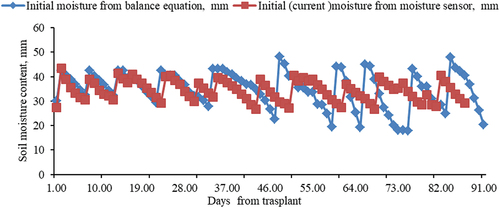
Figure 9. Net irrigation comparison for scheduling method.
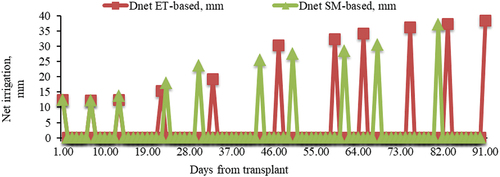
Table 4. Net requirement of irrigation water
Table 5. ANOVA for effects of irrigation scheduling methods on WUE
Table 6. ANOVA for the effect of irrigation scheduling methods on yield performance