
Figures & data
Figure 1. 3-Dimensional structures of RdRP SARS CoV-2 target proteins. 1- green color: RNA direct RNA polymerase (chain A), 2- brown and violet color non-structure protein 8 (chain B and chain D), 3- pink color: non-structure protein 7 (Chain C).
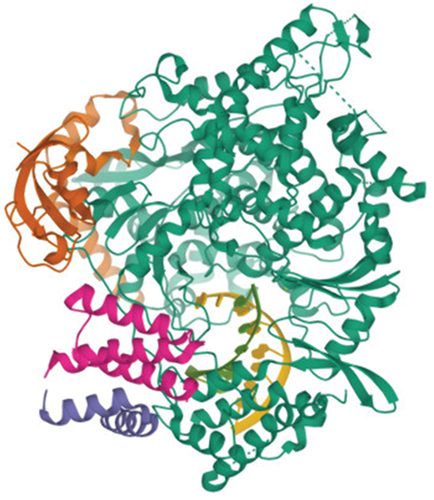
Figure 2. Chemical structure of olive oil compounds (a) apigenin and (b) taxifolin.
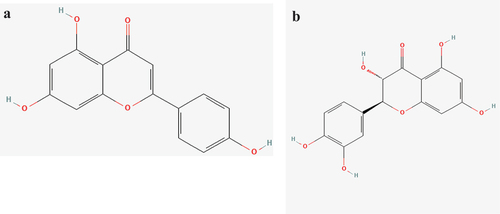
Figure 3. H-bond and interactions between ligands and RdRP SARS2-CoV-2. (a) apigenin interaction, (b) apigenin H-bond, (c) taxifolin interaction and (d) taxifolin H-bond.
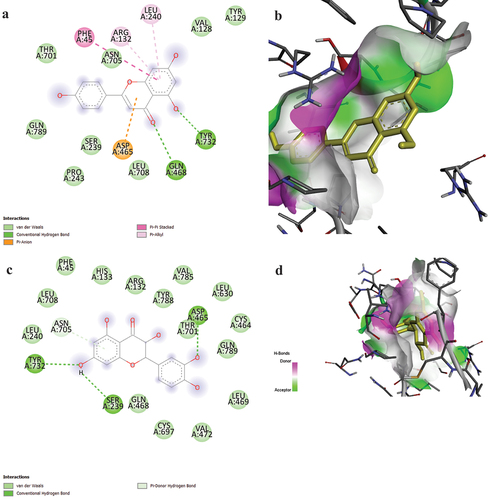
Table 1. Affinity score, PubChem ID, and Smile of olive oil molecules which are top ranked in docking
Table 2. The ADMET test with pKCSM of apigenin and taxifolin compound
Figure 4. The activity of apigenin and taxifolin against SARS-CoV-2. (a) CC50 of olive oil, (b) IC50 of olive oil, (c) CC50 of apigenin, (d) IC50 of apigenin, (e) CC50 of taxifolin, and (f) IC50 of taxifolin.
Table 3. Lipinski’s rule results for apigenin and taxifolin compounds
Table 4. CC50, IC50, and SI of apigenin and taxifolin compound against SARS-CoV-2
Table 5. Details of the three-dimensional crystal structure and grid box of HIV-RT and ZV-RdRP