
Figures & data
Figure 1. Schematic representation illustrating the systematic review process.
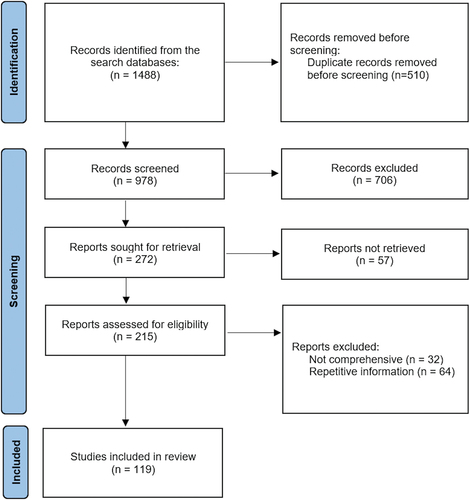
Figure 2. General livestock distribution maps are normalized by area. (a) Total bovine distribution. (b) Total small ruminant distribution. (c) Total poultry distribution. (d) Total inland aquaculture distribution.
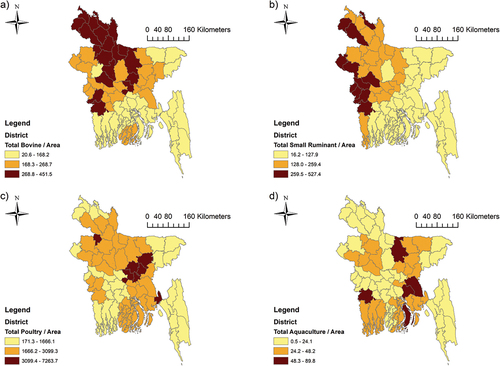
Figure 3. All cluster group’s livestock quantities (based on below average or above average) and explanatory variables.
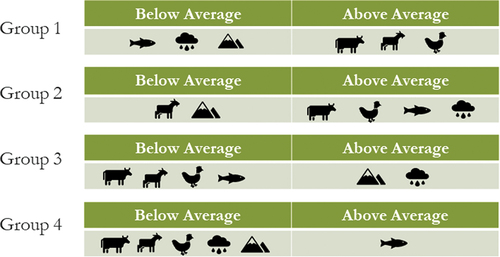
Table 1. Potential interventions to challenges facing livestock and aquaculture farming in Bangladesh
Supplemental material
Supplemental Material
Download MS Word (899.3 KB)Data availability statement
The datasets used and/or analyzed during the current study are available from the corresponding author upon reasonable request.