Figures & data
Table 1. Maximum residue limits for some common antibiotic drugs
Figure 1. Total ion chromatogram (TIC) of blank sample extract.
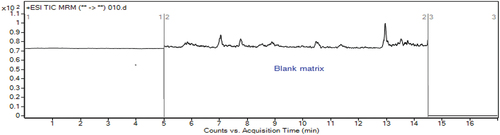
Figure 2. TIC from single injections of standard extract of each analyte.
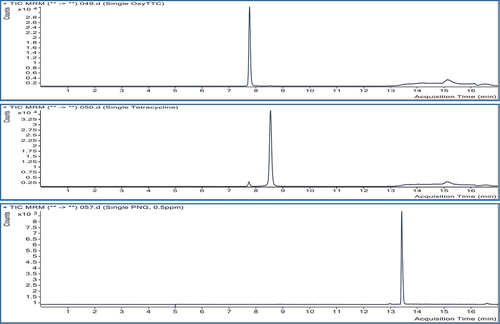
Table 2. Optimum mass parameters for each monitored ions in the analytical work
Table 3. System suitability parameters of the analytical method
Figure 3. TIC of (a) blank sample and (b) sample spiked with standard mix at MRLs.
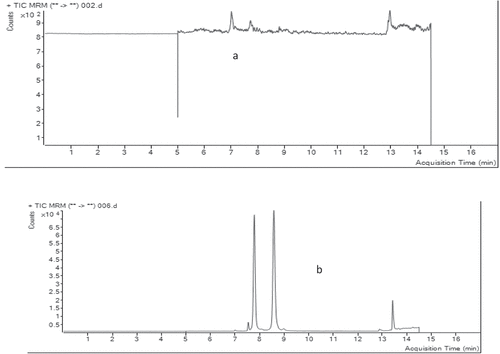
Figure 4. Extracted ion chromatograms of blank sample showing no interfering peaks.
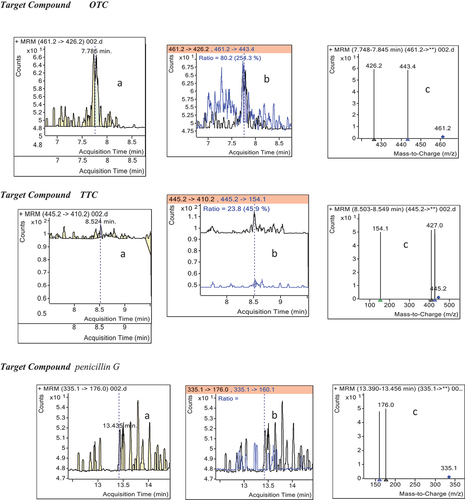
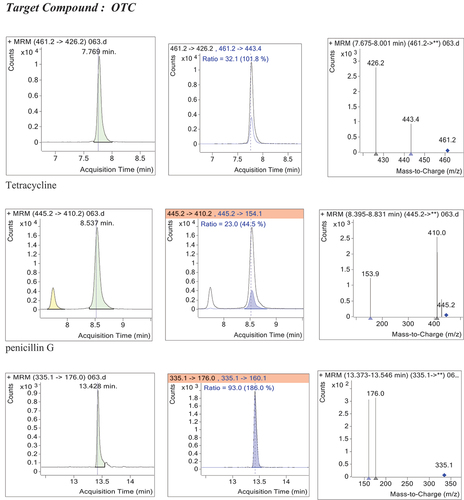
Figure 5. Positive control sample spiked with standard mix of the analytes at MRLs.
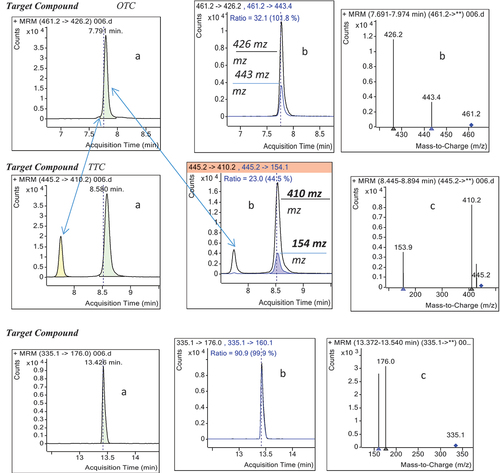
Table 4. Calibration data for OTC, TTC and Pen G residue analysis in Beef muscle
Table 5. Precision, accuracy, decision limits (CCα) and detection capabilities (CCβ)
Table 6. Retention times acquired for OTC, TTC and Pen G reference standards
Table 7. Relative ion ratios (IR) recorded for OTC, TTC and Pen G reference standards
Table 8. Oxytetracycline (OTC), Tetracycline (TC), and Pencillin G (PNG) residue levels in muscle samples in the study areas
Figure 6. Extracted ion chromatograms (EIC) of blank sample.
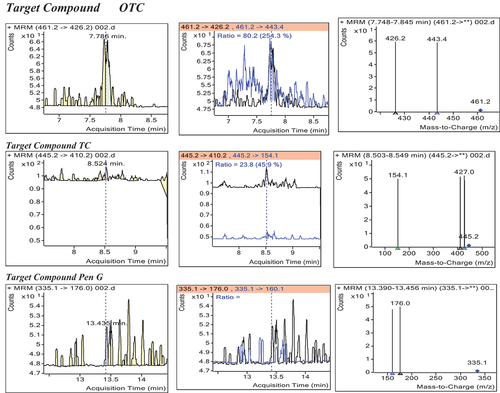
Figure 7. MRM of spiked sample with the three analytes (OTC, TTC and Pen G) at 100 μg/kg.