
Figures & data
Table 1. Gender-disaggregated ranking of the most preferred local cassava varieties
Table 2. Rationale for planting some important cassava varieties
Table 3. Quality characteristics of raw cassava prioritized by gender (% citation)
Table 4. Significant quality characteristics of boiled cassava identified during survey and processing diagnosis
Figure 1. Principal component analysis on sensory characteristics of the five boiled cassava varieties.
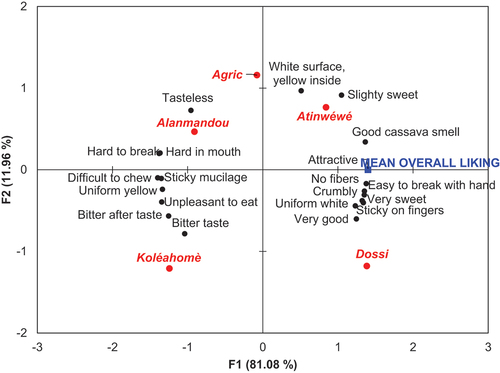
Table 5. Overall liking score of boiled cassava as affected by cassava varieties and dwelling place of consumers
Table 6. Mean drops and penalty of overall liking of boiled cassava
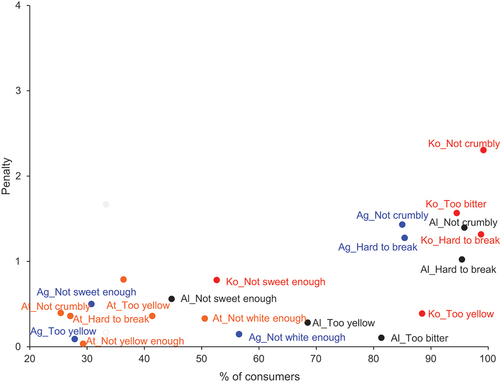
Figure 2. Significant penalties of overall liking per percent of consumers for studied varieties.
Legend: Variety_ not JAR category based on sensory descriptor (ex: Ko_Too bitter).Varieties: Agric (Ag), Alanmandou (Al), Atinwéwé (At), Dossi (Do), Koléahomè (Ko).Sensory descriptors: white colour, yellow colour, easy to break with the hand, crumbly in the mouth, sweet taste, bitter taste.Not JAR categories: too weak (Not enough), too strong (Too much).
Supplemental material