
Figures & data
Table 1. Results of variability analysis of 13 agro-morphological and five biochemical traits of 196 sugarcane genotypes evaluated on light soil (Cambisol) at Metahara sugar estate during May 2021 to November 2022
Table 2. Comparison of means of 12 local landraces against 184 introduced sugarcane genotypes based on 13 agro-morphological and five biochemical traits tested at Metahara sugar estate from May 2021-November 2022
Table 3. Comparison of means of 178 genotypes germinated from hybrid seeds against 12 local and six old collections based on 13 agro-morphological and five biochemical traits tested at Metahara sugar estate from May 2021-November 2022
Figure 1. Contributing factor loading plot (a; left hand side) and score plot (b; right hand side) of the 196 sugarcane genotypes based on 13 agro-morphological traits.
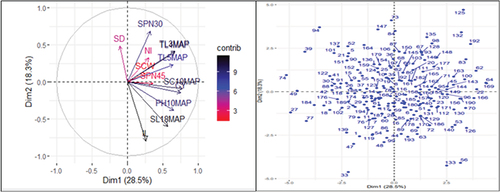
Table 4. Eigen values and vectors; and extent of variation for agro-morphological traits
Figure 2. Contributing factor loading plot (a; left hand side) and score plot (b; right hand side) of the 196 sugarcane genotypes based on five biochemical traits.
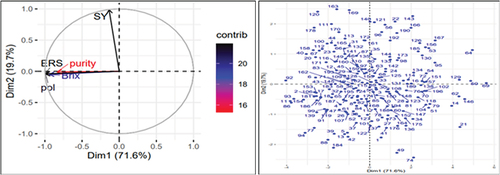
Table 5. Eigen values and vectors; and extent of variation for biochemical traits
Figure 3. Contributing factor loading plot (a; left hand side) and score plot (b; right hand side) of the 196 sugarcane genotypes based on combinations of 13 agro-morphological and five biochemical traits.
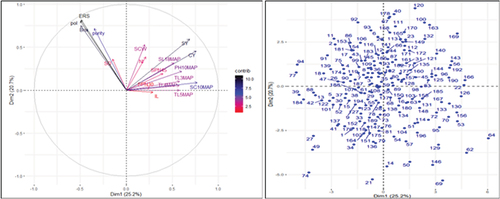
Table 6. Eigen values and vectors; and extent of variation of agro-morphological and biochemical traits
Figure 4. Dendrogram of 196 sugarcane genotypes based on 13 agro-morphological traits.
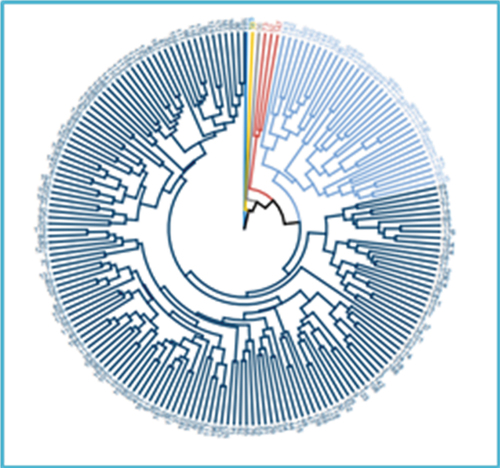
Figure 5. Dendrogram of 196 sugarcane genotypes based on five biochemical traits.
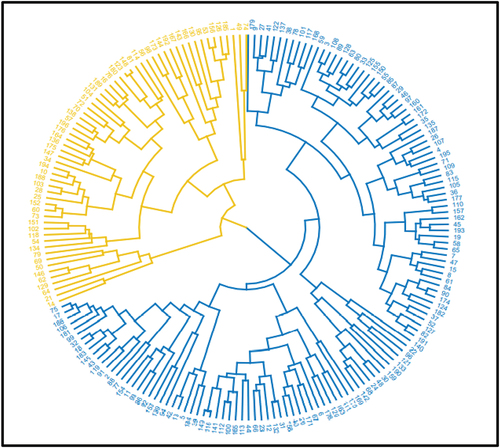
Table 7. Intercluster, intracluster, and mean distance based on 13 agro-morphological traits
Table 8. Clusters means based on 13 agro-morphological traits of 196 sugarcane genotypes evaluated at Metahara sugar estate during May 2021-November 2022 growing season
Table 9. Intercluster, intracluster, and mean distance based on five biochemical traits of 196 sugarcane genotypes evaluated at Metahara sugar estate during May 2021-November 2022 growing season
Table 10. Cluster means of 196 sugarcane genotypes based on five biochemical traits of 196 sugarcane genotypes evaluated at Metahara sugar estate during May 2021-November 2022 growing season
Figure 6. Dendrogram of 196 sugarcane genotypes based on combinations of 13 agro-morphological and five biochemical traits.
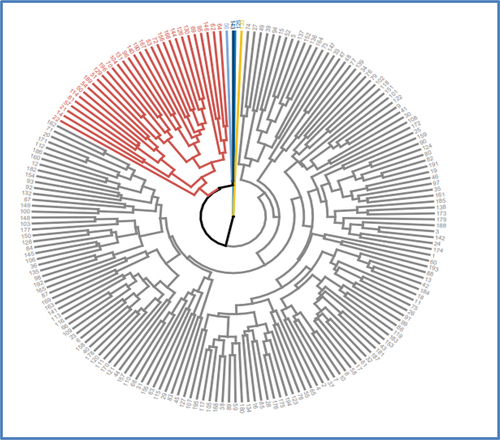
Table 11. Intercluster and intracluster genetic distances of 196 sugarcane genotypes based on 13 agro-morphological and five biochemical traits
Table 12. Cluster means of 196 sugarcane genotypes based on 13 agro-morphological and five biochemical traits
Supplemental Material
Download MS Word (54 KB)Data availability statement
The dataset collected and analyzed in the course of the present study is available from the corresponding author on reasonable request.