
Figures & data
Figure 1. Geographical location map of selected districts of West Hararghe Zone.
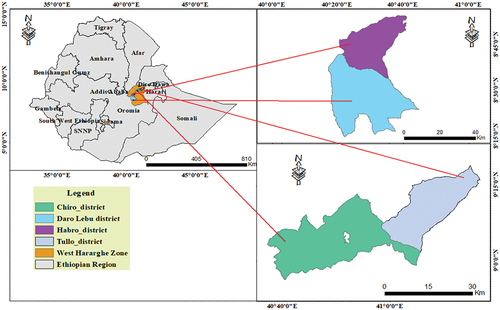
Table 1. Combined analysis of variance for the measured morphological trait of oat genotypes
Table 2. Location by year analysis of days of 50% flowering stage of oat genotypes during 2017 and 2018, at Daro Lebu, Habro, Chiro, and Tulo
Table 3. Location by year analysis of plant height (cm) of oat genotypes during 2017 and 2018, at Daro Lebu, Habro, Chiro, and Tulo
Table 4. Location by year analysis of biomass (t/ha) of oat genotypes during 2017 and 2018, at Daro Lebu, Habro, Chiro, and Tulo
Table 5. Location by year analysis of leaf-to-stem ratio of oat genotypes during 2017 and 2018, at Daro Lebu, Habro, Chiro, and Tulo
Table 6. Location by year analysis of dry matter (t/ha) of oat genotypes during 2017 and 2018, at Daro Lebu, Habro, Chiro, and Tulo
Table 7. Location by year analysis for maturity dates of oat genotypes during 2017 and 2018, at Daro Lebu, Habro, Chiro, and Tulo
Table 8. Location by year analysis of seed yield (qt/ha) of oat genotypes during 2017 and 2018, at Daro Lebu, Habro, Chiro, and Tulo
Table 9. ANOVA table for biomass yield in AMMI model at 2 years (2017 and 2018)
Table 10. ANOVA table for dry matter yield in AMMI model at 2 years
Table 11. Least square mean of eight oat genotypes with two check chemical compositions in Western Hararghe
Data availability statement
The data supporting the findings of this study are available from the corresponding authors upon request.