
Figures & data
Table 1. Raw material blends proportion
Figure 1. Contour plots for an expansion ratio of extrudates as a function of (a) moisture content (MC), blending ratio (BR), and (b) moisture content (MC) barrel temperature (BT).
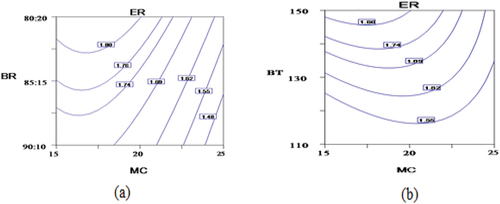
Figure 2. Contour plots for density as a function of (a) moisture content (MC), blending ratio (BR), (b) moisture content (MC), and barrel temperature (BT).
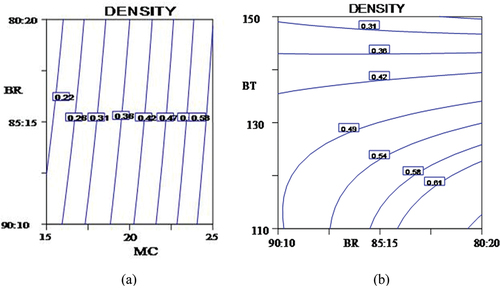
Figure 3. Contour plots for the hardness of extrudate as a function of (A) moisture content (MC), blending ratio (BR), (B) moisture content (MC), barrel temperature (BT), and (C) blending ratio (BR), and barrel temperature (BT).
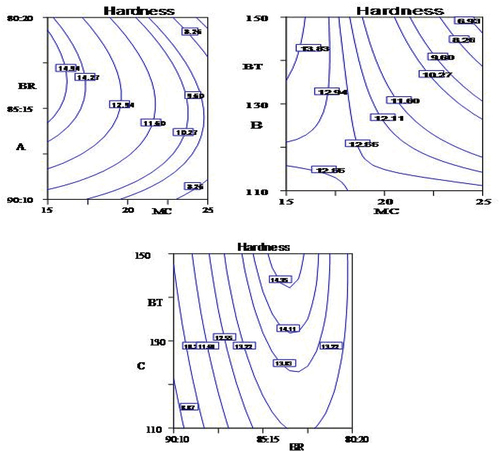
Figure 4. Contour plots for WAI as a function of (A) moisture content (MC), blending ratio (BR), (B) moisture content (MC), and barrel temperature (BT).
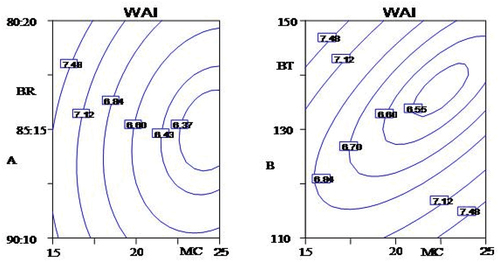
Figure 5. Contour plots for WSI as a function of moisture content (MC) and barrel temperature (BT).
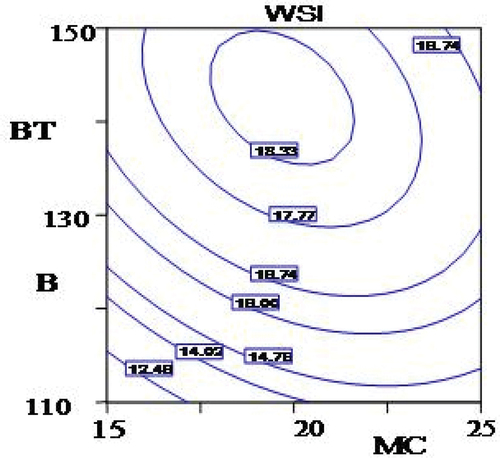
Table 2. Sensory quality evaluations of the extrudate