
Figures & data
Table 1. Definition of experimental domain
Figure 1. Effect of individual variables on flow velocities (a, b and c, d for Coca-sr and Atp-Y respectively) and reducing sugar contents of gruels (e, f and g, h for Coca-sr and Atp-Y respectively).
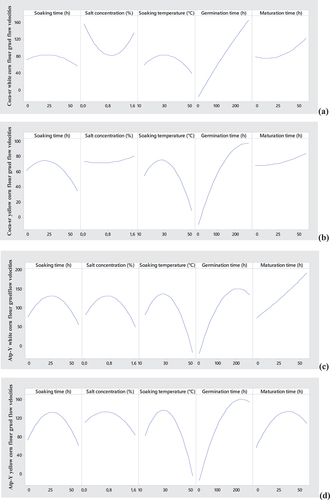
Figure 1. (Continued).
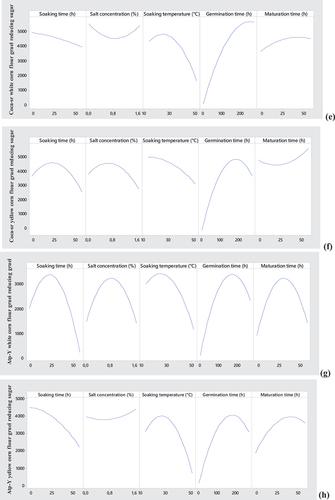
Figure 2. Contour plots showing the trade-off areas of significant interactions on flow velocity and reducing sugar content of the Atp-Y dehulled maize Atp-Y malt mixture.
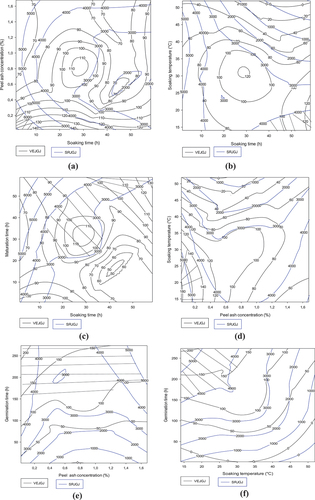
Figure 3. Contour plots showing the trade-off areas of significant interactions on flow velocity and reducing sugar content of the Coca-sr-germinated Atp-Y malt gruel mixture.
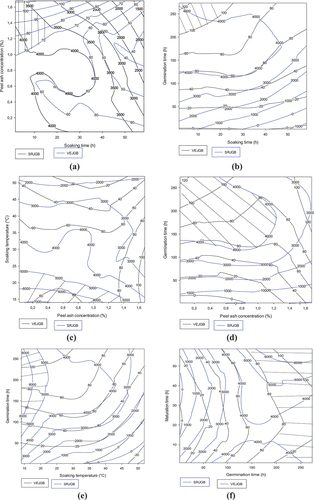
Figure 4. Contour plots showing the trade-off areas of significant interactions on flow velocity and reducing sugar content of the gruel made from mixture between germinated Atp-Y and dehulled Coca-sr.
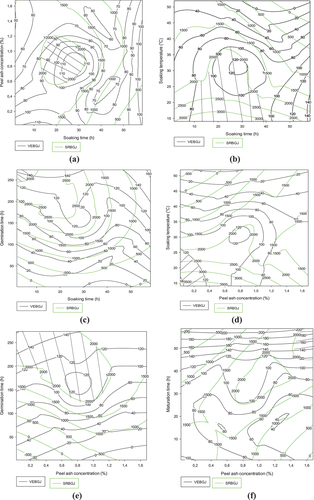
Figure 4. (Continued).
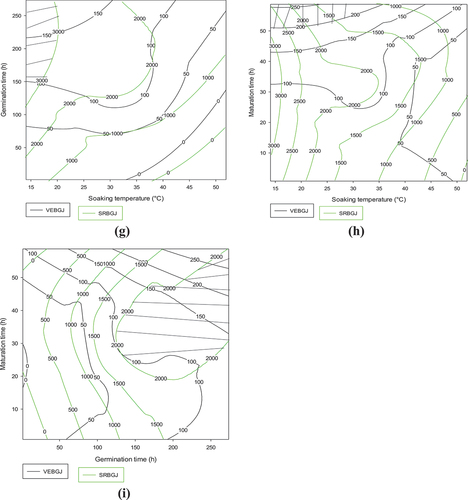
Figure 5. Contour plots showing the trade-off areas of significant interactions on flow velocity and reducing sugar content of Coca-sr dehulled maize-Coca-sr malt mixture.
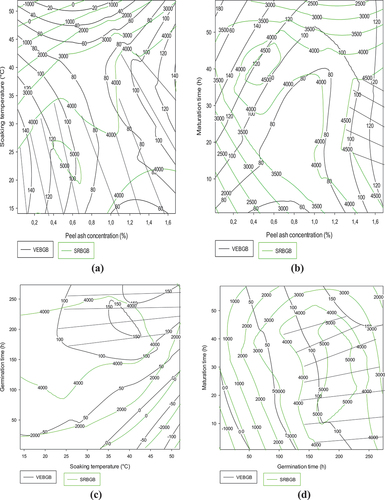
Table 2. Validation of the optimum conditions
Table 3. Determination of the physicochemical parameters of the two optimal flours
Supplemental Material
Download MS Word (80.9 KB)Data availability statement
The data that supports the findings of the study are available within the manuscript.