
Figures & data
Figure 1. Map of Peninsular Malaysia showing the location of the control (witness) and experimental plots.
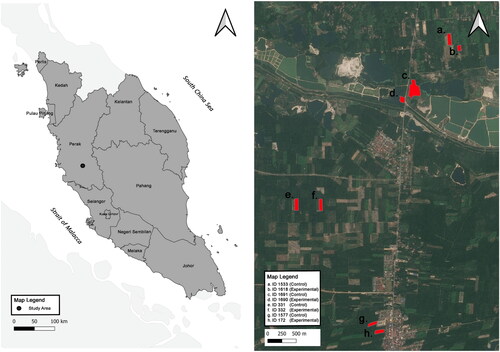
Table 1. Summary statistics of explanatory variables between witness and experimental plots.
Table 2. Spearman’s rank correlation results showing the degree of association between number of plant species and predictor variables.
Table 3. Results of one-way ANOVA comparing the insect assemblages between witness and experimental plots.
Supplemental material
Supplemental Material
Download MS Word (24.2 KB)Data availability statement
The authors confirm that the data supporting the findings of this study are presented within the article and its supplementary materials. Raw data supporting these findings can be obtained from the corresponding author upon reasonable request.