
Figures & data
Table 1. Chemical properties of vermicompost used in the experiment.
Table 2. Some physical and chemical properties of the soil used in the experiment.
Figure 1. Thermal image [A] taken from plants that clearly show the effects of treatments illustrates the pre-harvest vegetative development of plants under greenhouse conditions [B]. Error bars represent the standard error of the mean for each treatment (n = 3). Average values (n = 3) marked with different letters in the same column are significantly different according to Duncan post-hoc tests at P < 0.05.
![Figure 1. Thermal image [A] taken from plants that clearly show the effects of treatments illustrates the pre-harvest vegetative development of plants under greenhouse conditions [B]. Error bars represent the standard error of the mean for each treatment (n = 3). Average values (n = 3) marked with different letters in the same column are significantly different according to Duncan post-hoc tests at P < 0.05.](/cms/asset/2d86690e-a67d-4268-babd-19024d981c75/oafa_a_2373872_f0001_c.jpg)
Figure 2. The effect of vermicompost treatments on soil β-glucosidase [A], Urease [B], Catalase [C], and Dehydrogenase [D] enzyme activities investigated in the study. Error bars represent the standard error of the mean for each treatment (n = 3). Average values (n = 3) marked with different letters in the same column are significantly different according to Duncan post-hoc tests at P < 0.05.
![Figure 2. The effect of vermicompost treatments on soil β-glucosidase [A], Urease [B], Catalase [C], and Dehydrogenase [D] enzyme activities investigated in the study. Error bars represent the standard error of the mean for each treatment (n = 3). Average values (n = 3) marked with different letters in the same column are significantly different according to Duncan post-hoc tests at P < 0.05.](/cms/asset/45a15f7f-6dec-46de-ae90-1515cb75d341/oafa_a_2373872_f0002_c.jpg)
Figure 3. The effect of vermicompost treatments on macro and micro plant nutrient uptake and plant dry weight. Error bars represent the standard error of the mean for each treatment (n = 3). Average values (n = 3) marked with different letters in the same column are significantly different according to Duncan post-hoc tests at P < 0.05.
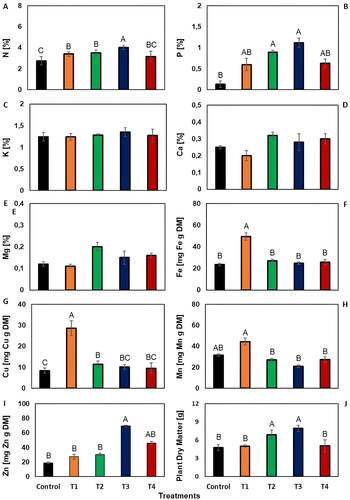
Figure 4. Correlation graph expressing the relationship among the parameters studied. Blue indicates positive correlation, while red and orange represent negative correlation. The intensity of the colors signifies the strength of the correlation, and the size of the circles denotes statistical significance.
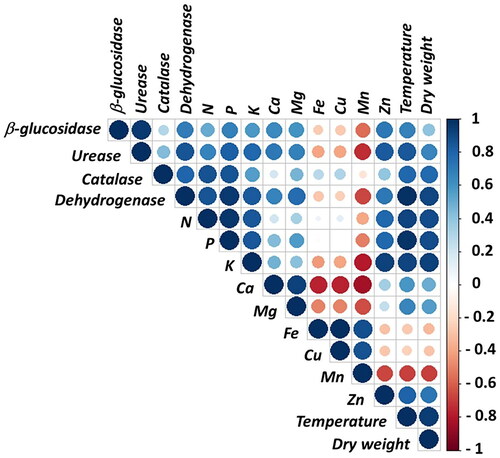
Figure 5. Network Analysis between the parameters analyzed in the study (dark blue lines represent significant positive effect pathways; yellow lines represent significant negative effect pathways).
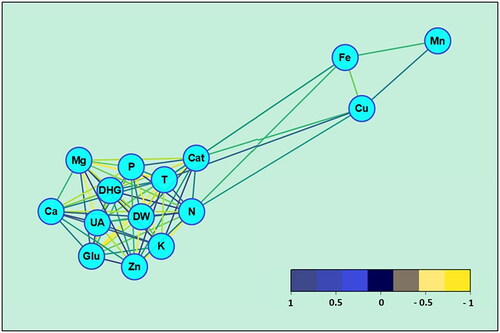
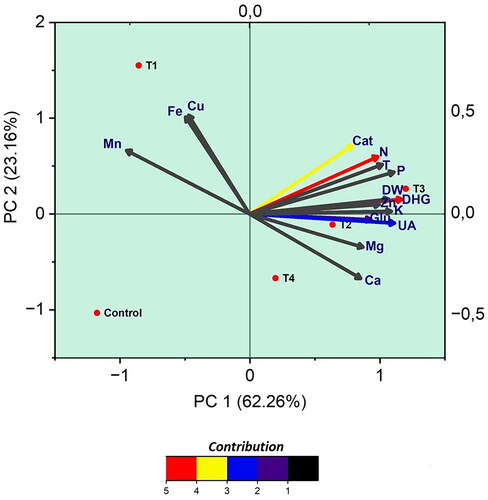
Figure 6. Biplot of principal component analysis (PCA) conducted with parameters examined in the study related to vermicompost treatments. Glu: β-glucosidase, T: Temperature, Cat: Catalase, DHG: Dehydrogenase, UA: Urease, DW: Dry Weight.
Data availability statement
The data that support the findings of this study are available on request from the corresponding author.