Figures & data
Figure 1. A network of online based-brand community impact on consumer-brand loyalty.
Table 1. Demographic profile of respondents
Table 2. Definition and summary of research constructs and their measured items
Table 3. Result of the PCA of the study constructs
Table 4. Quality criteria for outer reflective model
Table 5. Test of discriminant validity (Fornell-Lacker’s Criterion), R2, Mean and SD
Table 6. Estimate of the hypothesized structural path model significance
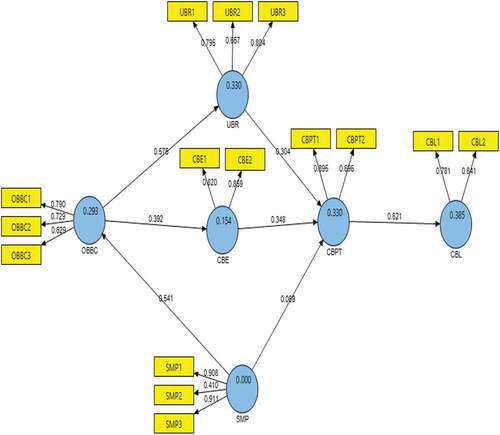
Figure A1. Visual description of estimated structural model Source: Authors’ Elaboration extracted from SmartPLS.