
Figures & data
Figure 1. Research model
Figure 2. Conceptual model of mediation
Figure 3. Overview of the structured model along with values of R-squared
Note: Confidence value (t value)
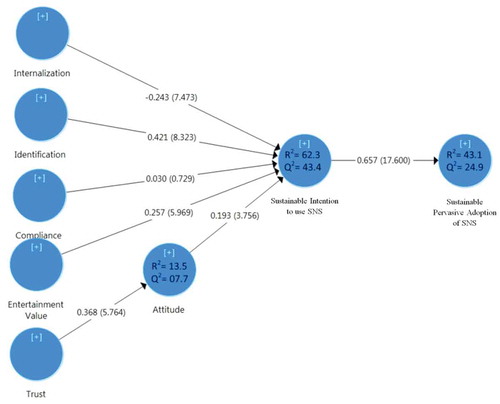
Table 1. Validity and reliability of measurement scales
Table 2. Demographics of respondents
Figure 4. Strength of mediation path
Table 3. Descriptive statistics and correlation analyses
Table 4. Hypothesis testing
Table 5. Mediation analysis