
Figures & data
Figure 1. Proposed theoretical model.
Source: Researchers’ own construct.
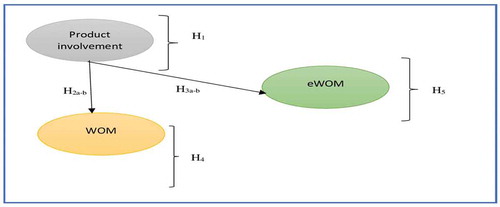
Table 1. Summary of measurement constructs and scale items
Table 2. Respondents’ demographic information
Table 3. Descriptive results
Table 4. Reliability results of the measurement scales
Table 5. Independent samples t-test results
Table 6. The interrelationship between product involvement, WOM, and eWOM
Table 7. Summary of findings from hypothesis testing