
Figures & data
Figure 1. Research model.
Source: Developed by author
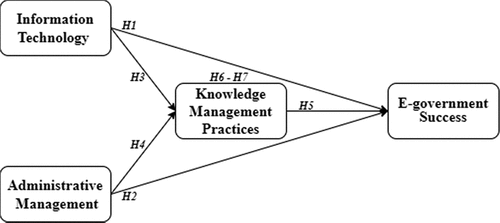
Table 1. Profile of participants (N = 163)
Table 2. Measurement model
Table 3. Discriminant validity
Table 4. Multicollinearity variance inflation, effect size, coefficient of determination,predictive relevance, and standardized root means square
Table 5. Direct and indirect hypotheses results