
Figures & data
Figure 1. Total number of publications by years and number of citations to these publications.
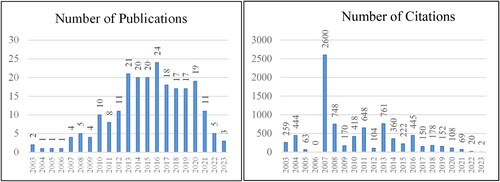
Figure 2. Number of citations to viral marketing publications between 2003 and 2023.
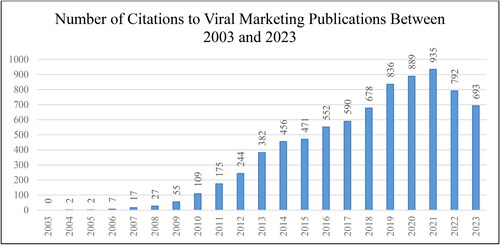
Table 1. Most cited authors and journals where their works are published.
Table 2. Co-authorship analysis (on the basis of universities) on viral marketing literature.
Figure 3. Co-authorization analysis of viral marketing literature.
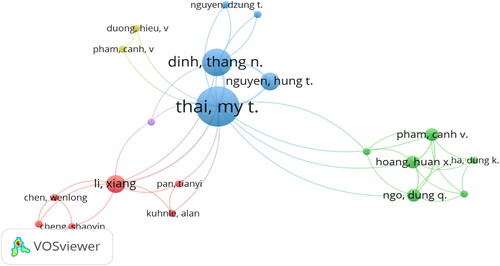
Figure 4. Most cited studies on viral marketing literature.
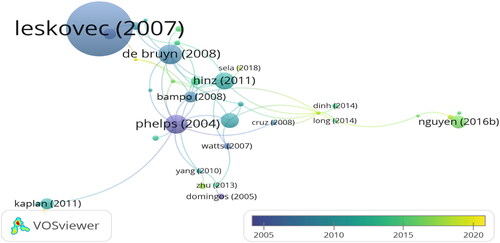
Table 3. Bibliographic matching analysis in terms of countries related to the literature.
Figure 5. Bibliographic matching analysis for viral marketing literature by countries.
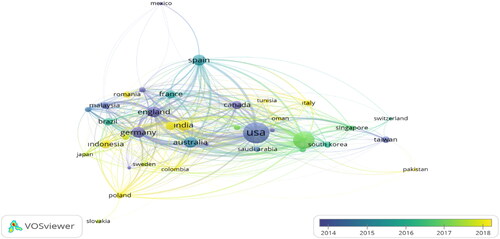
Figure 6. Journals with the most studies in viral marketing.
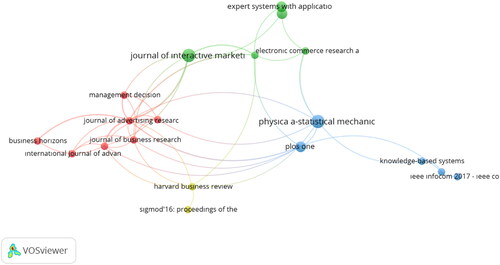
Figure 7. Co-occurrence analysis of keywords related to viral marketing literature by year.
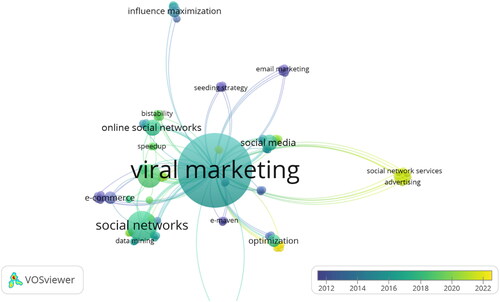
Figure 8. A collaborative analysis of the keywords in the viral marketing article on the basis of categories.
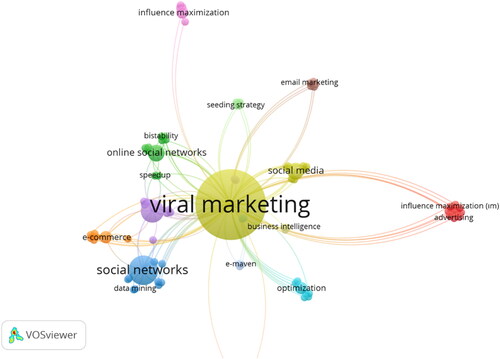
Table 4. Content analysis of studies in viral marketing literature.
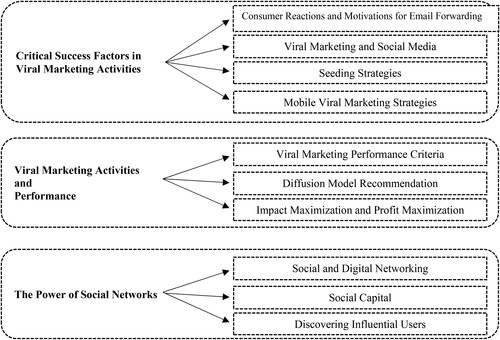
Figure 9. Figure 8 research framework—prominent categories and trends in viral marketing literature.
Data availability statement
The datasets generated during and/or analysed during the current study are available in the Web of Science database repository, https://www.webofscience.com/wos/woscc/summary/4b0318fc-b7f1-4cce-b118-a2809999cadd 5edd628c/relevance/1