Figures & data
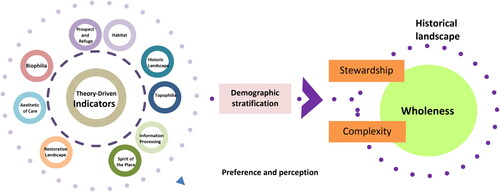
Figure 1. The theory-driven indicators.
Figure 2. The theory-driven indicators modified from Ode et al. (Citation2010).
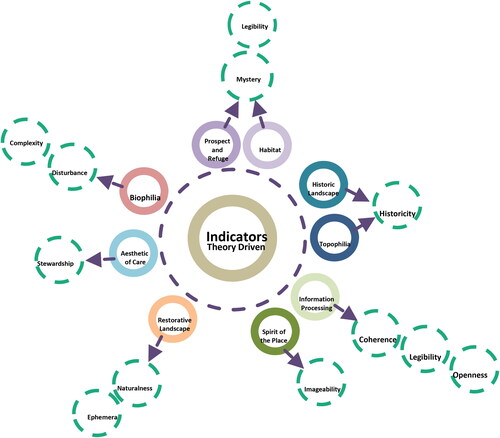
Figure 3. The keyword composition of the indicators.
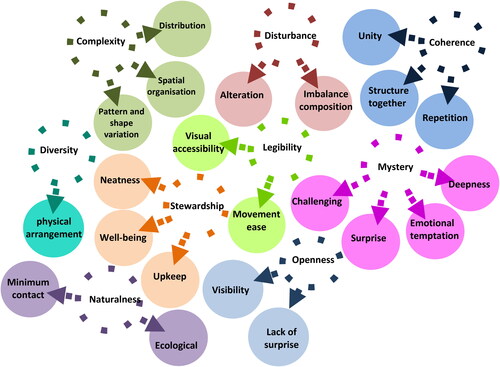
Figure 4. The composition of the photo-setting adopted from Rosley (Citation2013).
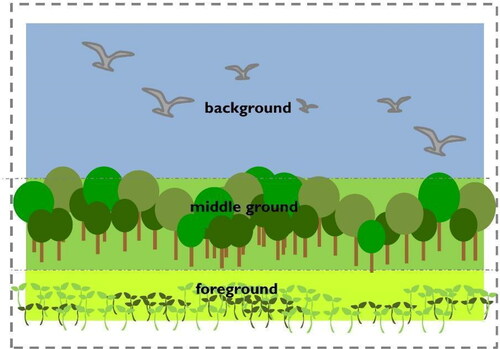
Figure 5. A compilation images of areas in the historical district of Melaka comprised of the Stadhuys buildings (Photos 1, 2, 4, and 5), the Melaka River (Photos 1 and 3) and the remnants of A’ Famosa Fort (Photo 3).
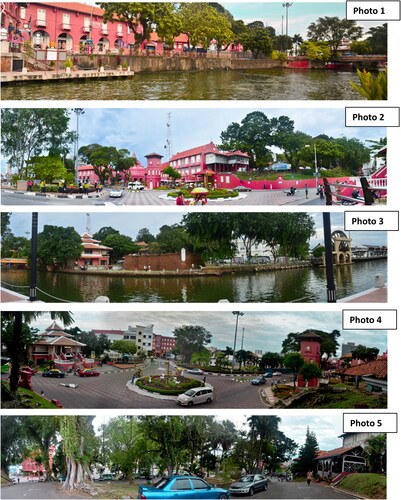
Table 1. Reliability and separation index.
Table 2. Point measured correlation and Z standard.
Table 3. Demographic profile of respondents.
Table 4. The compilation results of the t-test.
Figure 6. Model of visual landscape assessment in the historical landscape.