
Figures & data
Table 1. The operating conditions of ICP-OES
Figure 1. Plot of ICP-OES emission intensity versus total chromium concentration (CT = 0.0, 0.2, 0.8, 3.2, 6.4, and 12.8 ppm).
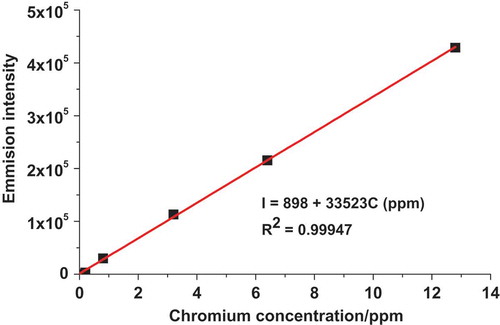
Table 2. Summary of the average total chromium concentration (CrT) in samples collected from two sites around Bahir Dar tannery using the ICP-OES
Figure 2. Plot of UV–Vis absorbance versus chromium (VI) concentration (0.00, 0.01, 0.05, 0.25, 0.75, and 1.25 ppm).
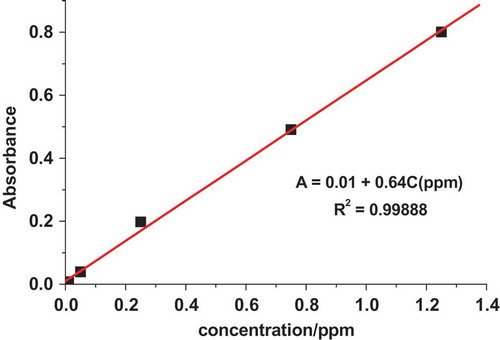
Table 3. Summary of the average Cr(VI) concentration in samples collected from the two sampling sites in Bahir Dar tannery
Table 4. Summary of the average Cr(III) concentration in the discharged effluent of Bahir Dar tannery collected from the two sites
Table 5. The maximum allowed concentration of chromium species that could be discharged to surface water after treatment according to different countries and WHO guidelines