576
Views
0
CrossRef citations to date
0
Altmetric
Research Article

Etomidate decreases adrenal gland apoptosis and necrosis associated with hemorrhagic shock in a rat model (Rattus norvegicus)

, , , , , , & | (Reviewing Editor) show all
Article: 1393864 | Received 28 Jun 2017, Accepted 15 Oct 2017, Published online: 25 Oct 2017

Figures & data

Figure 1. Experimental time line.
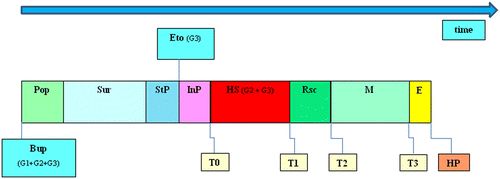
Notes: G0: control animals with general anesthesia, mechanical ventilation; G1: similar to G0 but with buprenorphine; G2: similar to G1 but subjected to shock; G3: similar to G2 but with etomidate administration. Pop-preoperative period; Sur, surgical intervention; StP, stabilization period; InP, intermediate period (in G3 only, lasting 5 min); HS, hemorrhagic shock; Rsc, resuscitation; M, maintenance stage; E, euthanasia; HP-histopathological analysis; Bup, buprenorphine; Eto, etomidate; Eto was only administered in G3. In G0 and G1, after StP, the animals went directly from M to E because they did not had the HS and Rsc stages.
Figure 1. Experimental time line.

Figure 2. Variation of hormonal variables from T0 to T3 in G0, G1, G2, and G3: (a) ACTH and (b) CS.
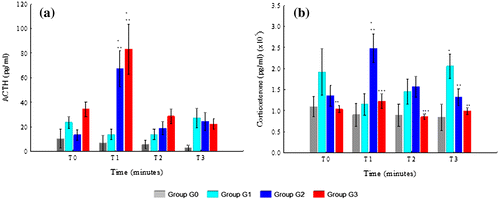
Notes: G0: control animals with general anesthesia and mechanical ventilation only; G1: similar to G0 but with buprenorphine; G2: similar to G1 but subjected to shock; G3: similar to G2 but with etomidate administration. Data expressed as mean ± SE. * indicates statistically significant differences between G1, G2, or G3 with G0; ** indicates statistically significant differences between G2 and G3 with G1; *** indicates statistically significant differences between G3 and G2. Statistical significance was established at p-value < 0.05. ACTH, adrenocorticotropic hormone; CS, corticosterone.
Figure 2. Variation of hormonal variables from T0 to T3 in G0, G1, G2, and G3: (a) ACTH and (b) CS.

Figure 3. Immunological variables: (a) TNF-α; (b) IL6 and (c) IL10.
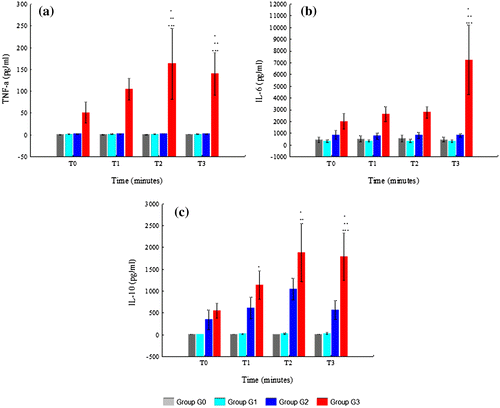
Notes: G0: control animals with general anesthesia and mechanical ventilation only; G1: similar to G0 but with buprenorphine; G2: similar to G1 but subjected to shock; G3: similar to G2 but with etomidate administration. Data expressed as mean ± SE. * indicates statistically significant differences between G1, G2, or G3 with G0; ** indicates statistically significant differences between G2 and G3 with G1; *** indicates statistically significant differences between G3 and G2.Statistical significance was established at p-value < 0.05. TNF-α, Tumor Necrosis Factor-α; IL6, Interleukin 6; IL10, Interleukin 10.
Figure 3. Immunological variables: (a) TNF-α; (b) IL6 and (c) IL10.

Figure 4. Variation of metabolic variables (pH, lactate, BE and HCO3) from T0 to T3 in G0, G1, G2, and G3: (a) pH; (b) lactate; (c) BE and (d) HCO3.
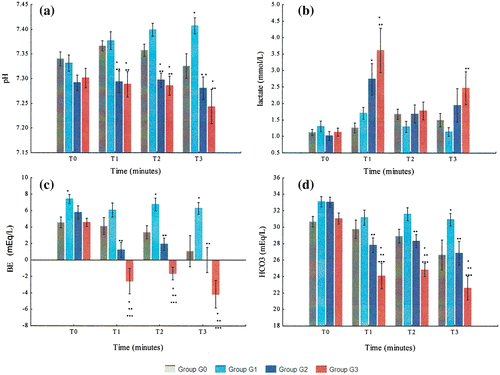
Notes: G0: control animals with general anesthesia and mechanical ventilation only; similar to G0 but with buprenorphine; G2: similar to G1 but subjected to shock; G3: similar to G2 but with etomidate administration. Data expressed as mean ± SE. * indicates statistically significant differences between G1, G2, or G3 with G0; ** indicates statistically significant differences between G2 and G3 with G1; *** indicates statistically significant differences between G3 and G2.Statistical significance was established at p-value < 0.05. BE, base excess.
Figure 4. Variation of metabolic variables (pH, lactate, BE and HCO3) from T0 to T3 in G0, G1, G2, and G3: (a) pH; (b) lactate; (c) BE and (d) HCO3.

Figure 5. Variation of metabolic variables (PO2 and PO2/FiO2) from T0 to T3 in G0, G1, G2, and G3: (a) PO2 and (b) PO2/FiO2.
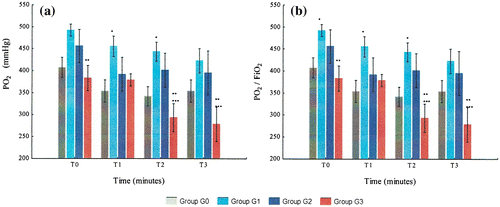
Notes: G0: control animals with general anesthesia and mechanical ventilation only; similar to G0 but with buprenorphine; G2: similar to G1 but subjected to shock; G3: similar to G2 but with etomidate administration. Data expressed as mean ± SE. * indicates statistically significant differences between G1, G2, or G3 with G0; ** indicates statistically significant differences between G2 and G3 with G1; *** indicates statistically significant differences between G3 and G2.Statistical significance was established at p-value < 0.05.
Figure 5. Variation of metabolic variables (PO2 and PO2/FiO2) from T0 to T3 in G0, G1, G2, and G3: (a) PO2 and (b) PO2/FiO2.

Figure 6. Variation of hemodynamic variables from T0 to T3 in G0, G1, G2, and G3: (a) HR and (b) MAP.
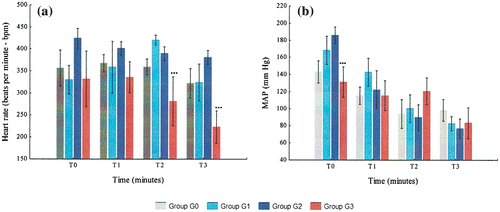
Notes: G0: control animals with general anesthesia and mechanical ventilation only; similar to G0 but with buprenorphine; G2: similar to G1 but subjected to shock; G3: similar to G2 but with etomidate administration. Data expressed as mean ± SE. * indicates statistically significant differences between G1, G2, or G3 with G0; ** indicates statistically significant differences between G2 and G3 with G1; *** indicates statistically significant differences between G3 and G2.Statistical significance was established at p-value < 0.05. HR, heart rate; MAP, mean arterial pressure.
Figure 6. Variation of hemodynamic variables from T0 to T3 in G0, G1, G2, and G3: (a) HR and (b) MAP.

Figure 7. Variation of the apoptotic index G0, G1, G2, and G3. Apoptosis score in G0, G1, G2, and G3: (a) apoptosis score in the adrenal cortex and (b) apoptosis score in the adrenal medulla.
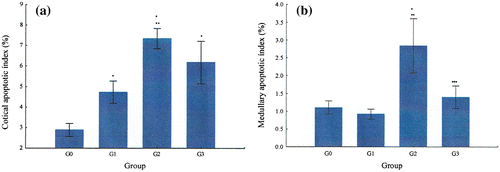
Notes: G0: control animals with general anesthesia and mechanical ventilation only; similar to G0 but with buprenorphine; G2: similar to G1 but subjected to shock; G3: similar to G2 but with etomidate administration. Data expressed as mean ± SE. * indicates statistically significant differences between G1, G2, or G3 with G0; ** indicates statistically significant differences between G2 and G3 with G1; *** indicates statistically significant differences between G3 and G2.Statistical significance was established at p-value < 0.05.
Figure 7. Variation of the apoptotic index G0, G1, G2, and G3. Apoptosis score in G0, G1, G2, and G3: (a) apoptosis score in the adrenal cortex and (b) apoptosis score in the adrenal medulla.

Figure 8. Pictures of TUNEL positive nuclei in the adrenal cortex and medulla and caspase-3 immunofluorescence analysis in G0 and G1.
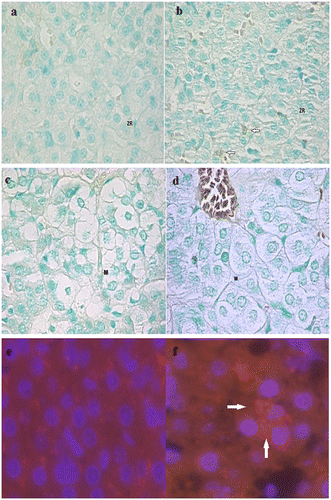
Notes: First row corresponds to sections of adrenal cortex; second row corresponds to sections of adrenal medulla; third row corresponds to pictures of caspase-3 immunofluorescence analysis in the adrenal cortex. The column of the left corresponds to G0 and the column of the right to G1. Pictures were taken at 400x magnification. (a) TUNEL in adrenal cortex of G0; (b) TUNEL in adrenal cortex of G1; (c) TUNEL in adrenal medulla of G0; (d) TUNEL in adrenal medulla of G1; (e) caspase-3 immunofluorescent analysis in G0; (f) caspase-3 immunofluorescent analysis in G1. Small white arrows in b indicate adrenal cortical cells from G1which stained TUNEL positive. Small white arrows in f indicate caspase-3 positive areas in adrenal cortical cells from G1, which appear with bright red. ZR, zona reticularis; M, adrenal medulla.
Figure 8. Pictures of TUNEL positive nuclei in the adrenal cortex and medulla and caspase-3 immunofluorescence analysis in G0 and G1.

Figure 9. Pictures of TUNEL positive nuclei in the adrenal cortex and medulla and caspase-3 immunofluorescence analysis in G2 and G3.
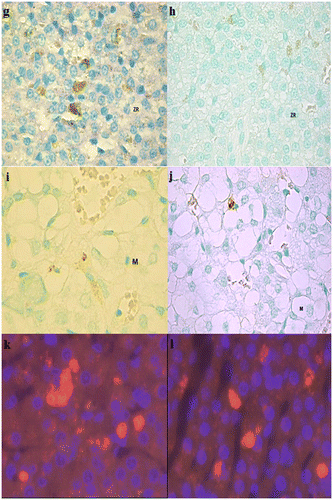
Notes: First row corresponds to sections of adrenal cortex; second row corresponds to sections of adrenal medulla; third row corresponds to pictures of caspase-3 immunofluorescence analysis in the adrenal cortex. The column of the left corresponds to G2 and the column of the right to G3. Pictures were taken at 400x magnification. (g) TUNEL in adrenal cortex of G2; (h) TUNEL in adrenal cortex of G3; (i)TUNEL in adrenal medulla of G2; (j) TUNEL in adrenal medulla of G3; (k) caspase-3 immunofluorescent analysis in G2; (l) caspase-3 immunofluorescent analysis in G3. ZR, zona reticularis; M, medulla.
Figure 9. Pictures of TUNEL positive nuclei in the adrenal cortex and medulla and caspase-3 immunofluorescence analysis in G2 and G3.

Figure 10. TUNEL positive cells in both adrenal cortex (zona reticularis) and medulla from an animal of G2.
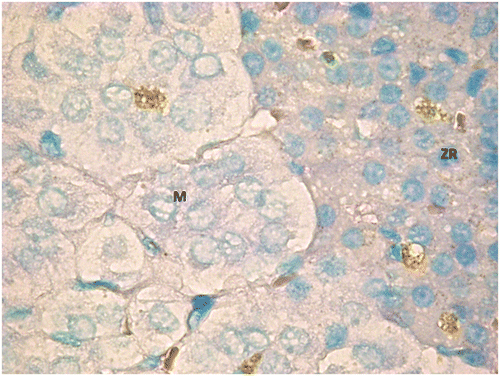
Notes: The picture shows that the adrenal cortex had a higher number of TUNEL positive cells than the medulla. Picture take at a 400x magnification ZR, zona reticularis; M, medulla.
Figure 10. TUNEL positive cells in both adrenal cortex (zona reticularis) and medulla from an animal of G2.

Figure 11. TUNEL positive adrenal cells in high resolution. TUNEL positive adrenal cells in high resolution; (m) zona reticularis of an animal of G2 and (n) adrenal medulla from an animal of G3.
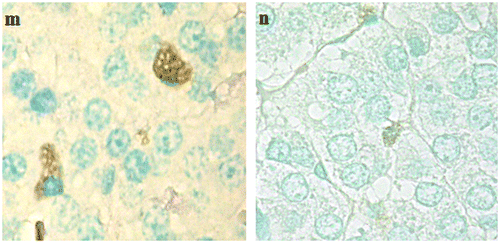
Figure 11. TUNEL positive adrenal cells in high resolution. TUNEL positive adrenal cells in high resolution; (m) zona reticularis of an animal of G2 and (n) adrenal medulla from an animal of G3.

Figure 12. Variation of the necrosis score in G0, G1, G2, and G3.
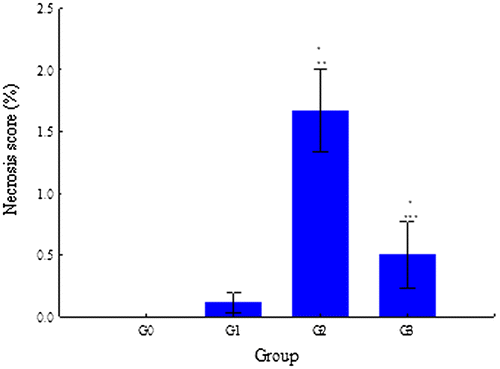
Notes: G0: control animals with general anesthesia and mechanical ventilation only; similar to G0 but with buprenorphine; G2: similar to G1 but subjected to shock; G3: similar to G2 but with etomidate administration. Data expressed as mean ± SE. * indicates statistically significant differences between G1, G2, or G3 with G0; ** indicates statistically significant differences between G2 and G3 with G1; *** indicates statistically significant differences between G3 and G2.Statistical significance was established at p-value < 0.05.
Figure 12. Variation of the necrosis score in G0, G1, G2, and G3.
Supplemental material

OABI_1393864_Supplementary_Material.doc

Download MS Word (81 KB)