Figures & data
Table 1. Anthropometrics, Lower Extremity Functional Scores (LEFS), and self-selected natural walking speed means and standard deviations (SD) for the obese and healthy participant groups
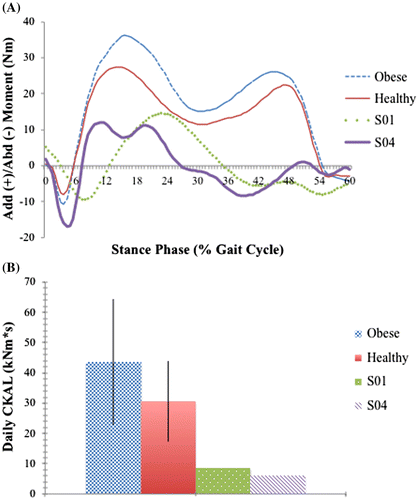
Figure 1. The knee adduction moment and CKAL of the two removed obese subjects, referred to as S01 and S04 compared to the mean obese and healthy-weight group knee adduction moments and CKAL.
Notes: The adduction waveforms of both S01 and S04 do not conform to typical knee adduction moments seen in individuals without musculoskeletal pathology. The CKAL for S04 and S01 is calculated from the self-selected natural walking speed, and is expressed in kNm s.

Table 2. Results for the knee angles and moments for obese and healthy-weight participants at the self-selected speed condition
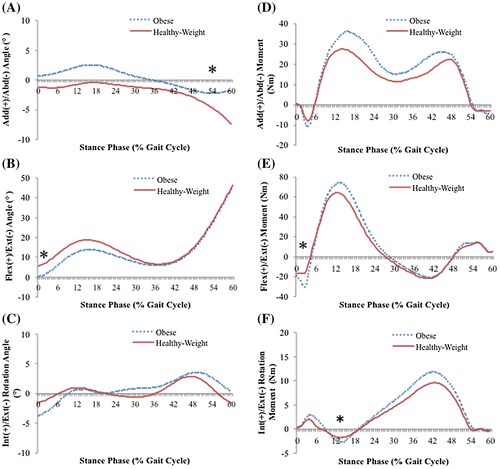
Figure 2. Average (A) adduction/abduction, (B) flexion/extension, (C) internal/external rotation angles, (D) adduction/abduction, (E) flexion/extension, (F) internal/external rotation moment waveforms for both participant groups at the combined self-selected speed condition.
Notes: In the self-selected speed condition, mean curves were determined using the three speeds of fast, self-selected, and slow. The healthy-weight group is represented by the solid line and the obese group is represented by the dotted line. A positive value on the vertical axis represents an adduction, flexion or internal rotation moment. Significant mean differences between groups are indicated by an asterisk where they occurred in the gait cycle.

Table 3. Results for the knee angles and moments for obese and healthy-weight participants at the matched speed condition
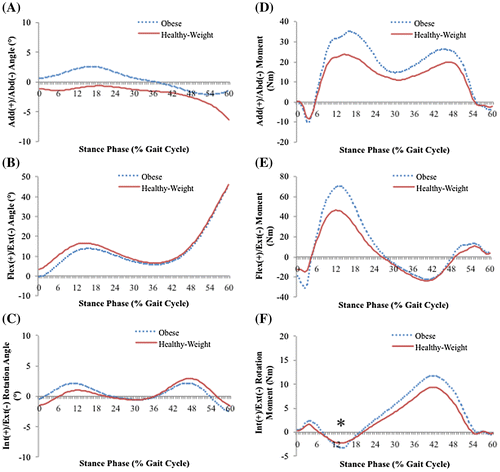
Figure 3. Average (A) adduction/abduction, (B) flexion/extension, (C) internal/external rotation angles, (D) adduction/abduction, (E) flexion/extension, (F) internal/external rotation moment waveforms for both participant groups at the matched speed condition.
Notes: The matched speed mean curves were determined using the self-selected speed for the obese group and the matched speed for the healthy-weight group. The healthy-weight group is represented by the solid line and the obese group is represented by the dotted line. A positive value on the vertical axis represents an adduction, flexion or internal rotation moment. Significant mean differences between groups are indicated by an asterisk where they occurred in the gait cycle.

Table 4. Group differences in stance duration (s), steps per day, moment impulse (Nm s), and cumulative knee adductor load (kNm s)
Table 5. The marker-based knee alignment of the two obese subjects removed from the data analysis during their self-selected natural walking speed
