
Figures & data
Table 1. Odds ratios (95% confidence intervals) for parsimonious multiple logistic regression models of the clinical variables associated with GI malignancy for the observation and validation cohorts (Poole Hospital 2004–2015)
Table 2. The percentage prevalence (with 95% CIs) of GI malignancy in 16 subgroups by sex, age and haemoglobin quartile of 1,363 subjects with IDA (Poole Hospital 2004–2015). Absolute numbers for each sub-group are shown immediately below.
Figure 1. The percentage prevalence of GI malignancy in 16 subgroups by sex, age and haemoglobin quartile of 1,363 subjects with IDA (Poole General 2004–2015). Haemoglobin quartile ranges are as in .
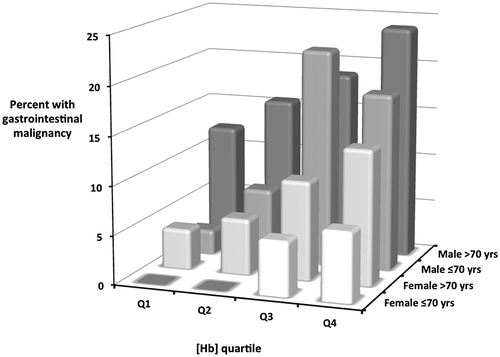
Table 3. Univariate odds ratios (95% CIs) and significance levels for the associations between other clinical characteristics and GI malignancy in 315 subjects (Poole Hospital 2012–2015)