636
Views
3
CrossRef citations to date
0
Altmetric
Research Article

Effects of visual feedback on motion mimicry ability during video-based rehabilitation

, , & | (Reviewing Editor)
Article: 1215284 | Received 06 Jun 2016, Accepted 18 Jul 2016, Published online: 23 Aug 2016

Figures & data

Figure 1. Sensor unit encased in a customized belt with adjustable width.

Figure 1. Sensor unit encased in a customized belt with adjustable width.

Figure 2. Example photos of instructor performing movement tasks (A) elbow flexion, (B) leg raise, and (C) shoulder stretch.
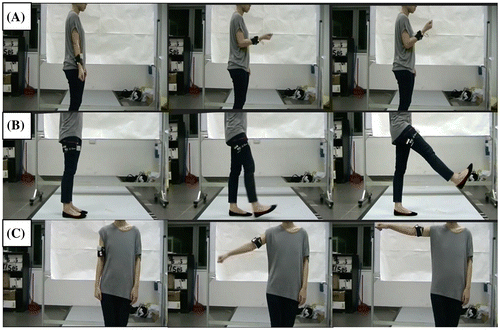
Figure 2. Example photos of instructor performing movement tasks (A) elbow flexion, (B) leg raise, and (C) shoulder stretch.

Figure 3. Feedback system interface showing the “Best” region switched on.

Notes: (From left to right) The percentage range for each region are: Poor (0–49%), Average (50–69%), Good (70–89%), Best (90–110%), Good (111–130%), Average (131–150%), Poor (151–200%).

Figure 3. Feedback system interface showing the “Best” region switched on.Notes: (From left to right) The percentage range for each region are: Poor (0–49%), Average (50–69%), Good (70–89%), Best (90–110%), Good (111–130%), Average (131–150%), Poor (151–200%).

Table 1. Summary of mimicking ability of subjects for each movement task

Figure 4. Results for each movement task shown with error bars (standard deviation across three trials) (A) elbow flexion, (B) leg raise, and (C) shoulder stretch.

Note: The “no feedback” and “feedback” conditions are depicted by the light and dark grey bar respectively.
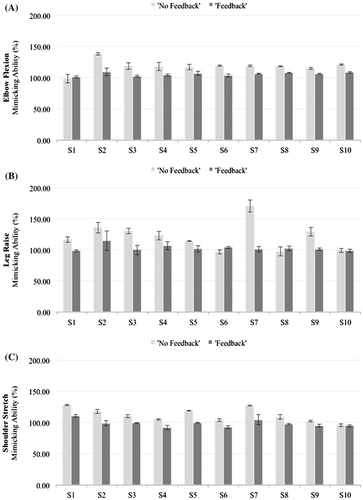
Figure 4. Results for each movement task shown with error bars (standard deviation across three trials) (A) elbow flexion, (B) leg raise, and (C) shoulder stretch.Note: The “no feedback” and “feedback” conditions are depicted by the light and dark grey bar respectively.

Figure 5. Average graph for each movement task for all 10 subjects (representative of 1 data-set) (A) elbow flexion, (B) leg raise, and (C) shoulder stretch.

Notes: The “no feedback” condition is depicted by a black line with gray shaded area (standard deviation). The “feedback” condition is depicted by a black dashed line with light gray shaded area (standard deviation). The 100% line provides a visual comparison of the maximum points for the “no feedback” and “feedback” conditions.
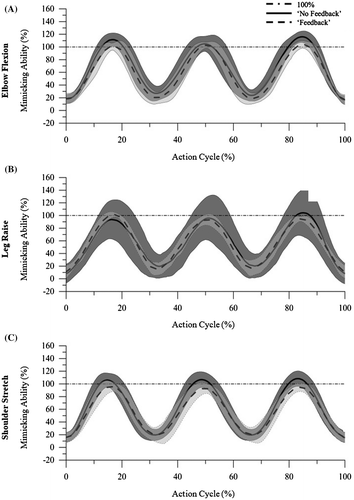
Figure 5. Average graph for each movement task for all 10 subjects (representative of 1 data-set) (A) elbow flexion, (B) leg raise, and (C) shoulder stretch.Notes: The “no feedback” condition is depicted by a black line with gray shaded area (standard deviation). The “feedback” condition is depicted by a black dashed line with light gray shaded area (standard deviation). The 100% line provides a visual comparison of the maximum points for the “no feedback” and “feedback” conditions.