703
Views
0
CrossRef citations to date
0
Altmetric
Research Article

Small intestine morphology and recovery after drug-induced colitis in proglucagon-derived peptides knockout mice

, , , , , , , & | (Reviewing Editor) show all
Article: 1215783 | Received 06 Jul 2016, Accepted 19 Jul 2016, Published online: 13 Oct 2016

Figures & data

Figure 1. Expression of the GLP-1 and GLP-2 mRNA of PGDPs+/+ and PGDPs−/− mice. Expressions of GLP-1 and GLP-2 are not observed in the PGDPs−/− mice.
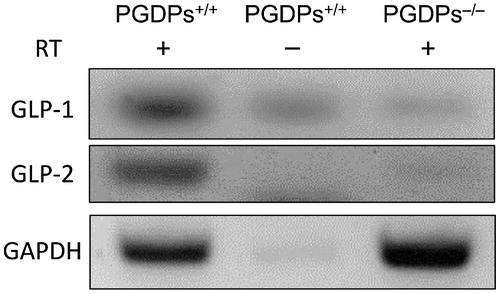
Figure 1. Expression of the GLP-1 and GLP-2 mRNA of PGDPs+/+ and PGDPs−/− mice. Expressions of GLP-1 and GLP-2 are not observed in the PGDPs−/− mice.

Figure 2. (A) Villous height of the duodenum and three parts of the small intestine. No significant differences in villous height in each section are observed between the PGDPs−/− and PGDPS+/+ mice. A decrease in villous height is observed in both groups; the villous height of the small intestine is 34% of that in the duodenum in the PGDPs−/− mice and 40% in the PGDPS+/+ mice. (B) Crypt depth of the duodenum and three parts of the small intestine. No significant differences in crypt depth in each section are observed between the PGDPs−/− and PGDPS+/+ mice. Crypt depth shows no decline from the oral to anal side.

Each bar represents the mean height or depth and standard deviation.
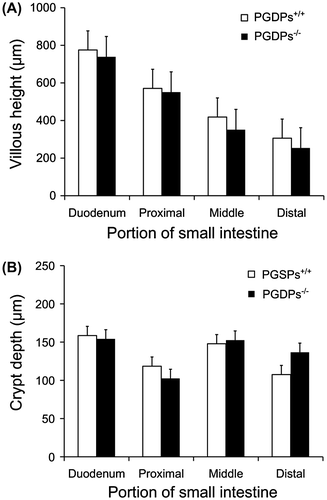
Figure 2. (A) Villous height of the duodenum and three parts of the small intestine. No significant differences in villous height in each section are observed between the PGDPs−/− and PGDPS+/+ mice. A decrease in villous height is observed in both groups; the villous height of the small intestine is 34% of that in the duodenum in the PGDPs−/− mice and 40% in the PGDPS+/+ mice. (B) Crypt depth of the duodenum and three parts of the small intestine. No significant differences in crypt depth in each section are observed between the PGDPs−/− and PGDPS+/+ mice. Crypt depth shows no decline from the oral to anal side.Each bar represents the mean height or depth and standard deviation.

Figure 3. (A) Time-dependent changes in disease activity index. The increases after the administration of dextran sodium for 5 days in the disease activity index until day 6 and the decline by day 12 are shown. Each point represents the mean ± SD of 7 PGDPs−/− and 7 PGDPS+/+ mice. (B) Time-dependent changes in BW. The decline in BW until day 9 and the recovery to 95% by day 20 are shown. Each point represents the mean ± SD of 7 PGDPs−/− and 7 PGDPS+/+ mice.
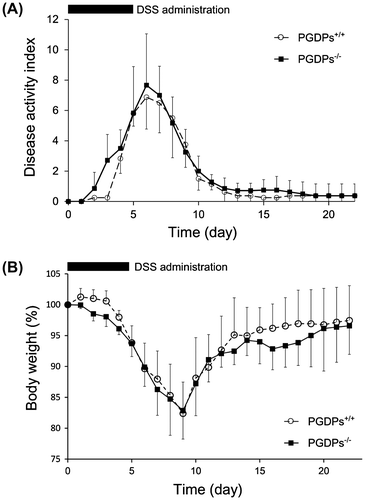
Figure 3. (A) Time-dependent changes in disease activity index. The increases after the administration of dextran sodium for 5 days in the disease activity index until day 6 and the decline by day 12 are shown. Each point represents the mean ± SD of 7 PGDPs−/− and 7 PGDPS+/+ mice. (B) Time-dependent changes in BW. The decline in BW until day 9 and the recovery to 95% by day 20 are shown. Each point represents the mean ± SD of 7 PGDPs−/− and 7 PGDPS+/+ mice.

Figure 4. (A) Histological score of distal small intestine on colitis no significant differences were observed in histological score of distal small intestine between the PGDPs−/− and PGDPS+/+ mice. (B) Histological score of distal colon on colitis was not different on day 7 between the PGDPs−/− and PGDPS+/+ mice. On day 21, however, histological score of distal colon of PGDPs−/− was significantly higher than that of PGDPs−/−.

*p < 0.05.
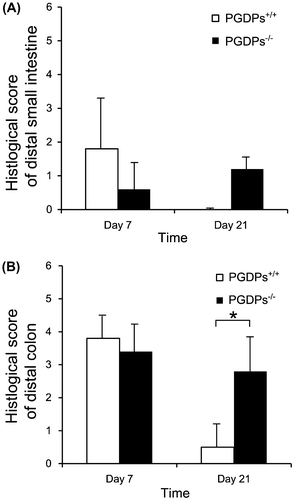
Figure 4. (A) Histological score of distal small intestine on colitis no significant differences were observed in histological score of distal small intestine between the PGDPs−/− and PGDPS+/+ mice. (B) Histological score of distal colon on colitis was not different on day 7 between the PGDPs−/− and PGDPS+/+ mice. On day 21, however, histological score of distal colon of PGDPs−/− was significantly higher than that of PGDPs−/−.*p < 0.05.