890
Views
6
CrossRef citations to date
0
Altmetric
Research Article

Predictions of resting energy expenditure in amyotrophic lateral sclerosis are greatly impacted by reductions in fat free mass

, , , , & | (Reviewing Editor) show all
Article: 1343000 | Received 23 May 2017, Accepted 08 Jun 2017, Published online: 23 Jun 2017

Figures & data

Table 1. Comparison of key factors considered when predicting resting energy expenditure (pREE) using the Harris Benedict, Mifflin-St Jeor and Nelson prediction models, and models that correct for fat free mass (FFM)

Table 2. Demographics, anthropometric, body composition and predicted resting energy expenditure for control and ALS participants

Figure 1. Box and whisker plots showing the distributions of body mass (A), body mass index (BMI; B), fat free mass (C), and fat mass (D) in control (Con) and amyotrophic lateral sclerosis (ALS) participants. The box represents the lower, median and upper quartiles, and the whiskers illustrate the lowest to the highest observation.
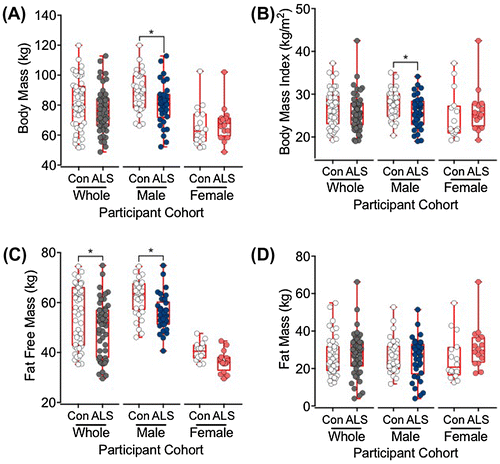
*p < 0.05 by unpaired students t-test.
Figure 1. Box and whisker plots showing the distributions of body mass (A), body mass index (BMI; B), fat free mass (C), and fat mass (D) in control (Con) and amyotrophic lateral sclerosis (ALS) participants. The box represents the lower, median and upper quartiles, and the whiskers illustrate the lowest to the highest observation.

Figure 2. Bland-Altman plots illustrating the bias between predicted resting energy expenditure (pREE) outcomes using the Harris-Benedict (A), Mifflin-St Jeor (B), and Nelson (C) prediction models, and predictions of REE following correction for fat free mass (FFM). Plots demonstrate the mean bias (MB, broken red line) of prediction models and estimated 95% agreement intervals (broken grey lines) between prediction models.
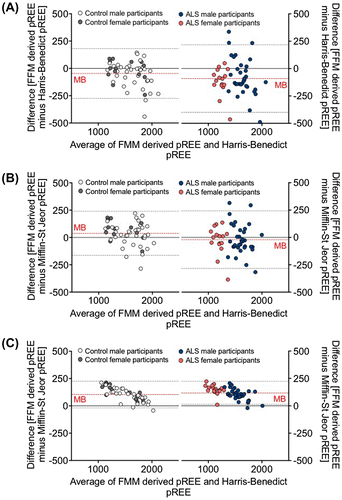
Abbreviations: FFM, fat free mass; pREE, predicted resting energy expenditure; ALS, amyotrophic lateral sclerosis.
Figure 2. Bland-Altman plots illustrating the bias between predicted resting energy expenditure (pREE) outcomes using the Harris-Benedict (A), Mifflin-St Jeor (B), and Nelson (C) prediction models, and predictions of REE following correction for fat free mass (FFM). Plots demonstrate the mean bias (MB, broken red line) of prediction models and estimated 95% agreement intervals (broken grey lines) between prediction models.

Figure 3. Scatter plots illustrating differences in predicted resting energy expenditure (pREE) outcomes when using the Harris-Benedict, Mifflin-St Jeor and Nelson prediction models in control (top panels) and ALS (bottom panels) participants.
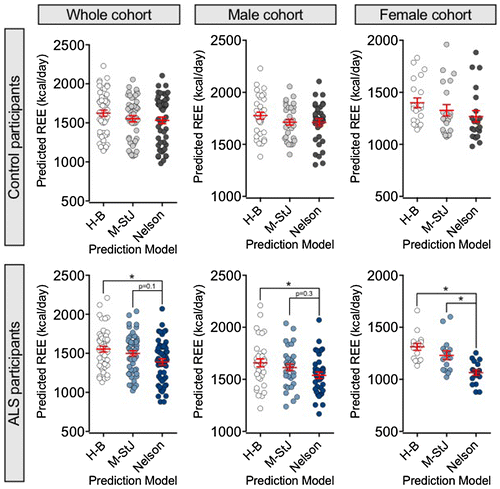
Abbreviations: REE, resting energy expenditure; Harris-Benedict, H-B; Mifflin-St Jeor, M-StJ, ALS, amyotrophic lateral sclerosis. *p < 0.05 by ANOVA and multiple comparison corrected by Bonferroni post hoc analysis. Data presented as Mean ± SEM.
Figure 3. Scatter plots illustrating differences in predicted resting energy expenditure (pREE) outcomes when using the Harris-Benedict, Mifflin-St Jeor and Nelson prediction models in control (top panels) and ALS (bottom panels) participants.

Figure 4. Bland-Altman plots illustrating the bias between predicted resting energy expenditure (pREE) outcomes using the Harris-Benedict and Mifflin-St Jeor (A), Nelson and Harris-Benedict (B), and Nelson and Mifflin-St Jeor prediction models (C). Plots demonstrate the mean bias (MB, broken red line) of prediction models and estimated 95% agreement intervals (broken grey lines) between prediction models.

Abbreviations: pREE, predicted resting energy expenditure; ALS, amyotrophic lateral sclerosis.
Figure 4. Bland-Altman plots illustrating the bias between predicted resting energy expenditure (pREE) outcomes using the Harris-Benedict and Mifflin-St Jeor (A), Nelson and Harris-Benedict (B), and Nelson and Mifflin-St Jeor prediction models (C). Plots demonstrate the mean bias (MB, broken red line) of prediction models and estimated 95% agreement intervals (broken grey lines) between prediction models.