
Figures & data
Figure 1. Eye Health Screening Program Designs.
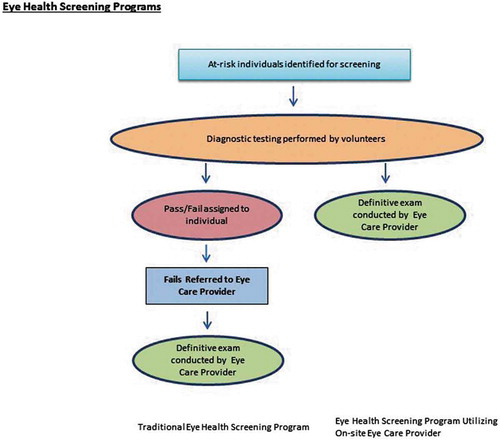

Table 1. Demographics from the CEIO program (N = 4349 visits)
Table 2. Distribution of abnormal findings in CEIO program (N = 4349)
Table 3. Distribution of abnormal findings leading to referral for clinical care from the CEIO program (N = 4349)