
Figures & data
Table 1. Participant characteristics for the neglect group (NEG, n = 10), elderly healthy group (EH, n = 11), and young healthy group (YH, n = 15)
Figure 1. Photograph of a participant using the virtual reality apparatus and a scene in the virtual reality task.
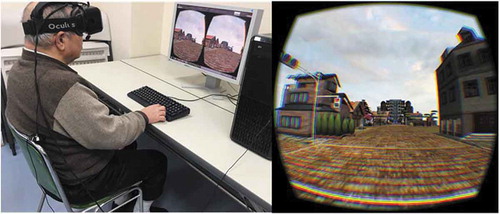
Figure 2. Overview of the virtual reality task environment.
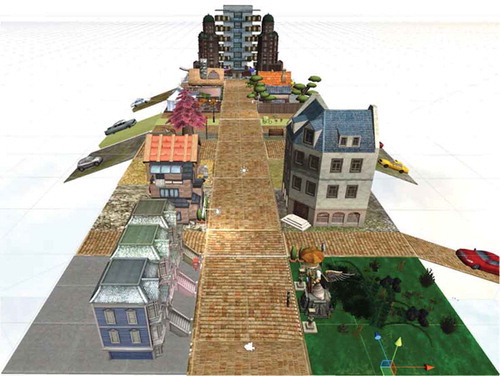
Figure 3. The 18 targets that appear in the virtual reality task.
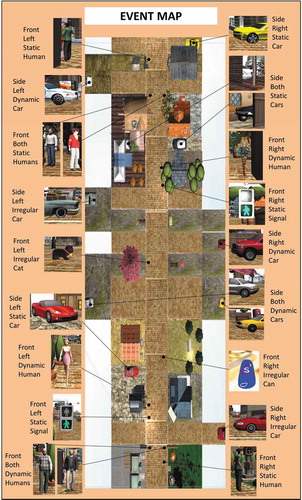
Table 2. Clinical demographics and the neglect group test results
Table 3. The virtual reality task results [neglect (NEG), elderly healthy (EH), and young healthy (YH) groups]
Figure 4. Lesion pattern of case 2 (magnetic resonance imaging fluid-attenuated inversion recovery).
Table 4. Detection percentage of each target (left-side stimulation or right-side stimulation) in the virtual reality task [neglect (NEG) and elderly healthy (EH) groups]
Table 5. Detection percentage of each target (both-sides stimulation) in the virtual reality task [neglect (NEG) and elderly healthy (EH) groups]
Table 6. Detection percentage of both-sides stimulation in the virtual reality task (neglect group)