
Figures & data
Figure 1. Flow of participants
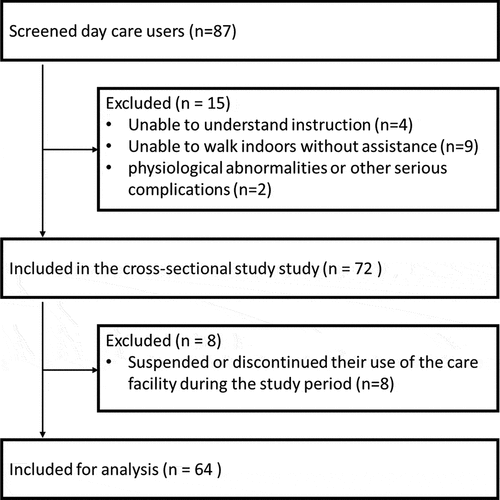
Table 1. Participants’ characteristics (n = 64)
Table 2. Participants’ LSA score, level of mobility/locomotion, frequency of entry into each life space, and degree of independence
Table 3. Measurement results of the Mini-BESTest, SWWT, and MFES
Table 4. Spearman correlation coefficients between the LSA score and age, BMI, the sub-item scores and total score of the Mini-BESTest, and the MFES (n = 64)
Table 5. Results of the stepwise multiple linear regression analysis with the LSA score as dependent variable (n = 64)