Figures & data
Table 1. The burden of disease, as a percentage of all DALYs, from five non-communicable diseases in the United Kingdom (UK) and Ireland (IE), 2000 and 2015, and the ratio between them
Table 2. The burden of disease, as a percentage of all DALYs from cancer and from mental health disorders, from six manifestations of cancer and six mental health disorders in the United Kingdom (UK) and Ireland (IE), 2000 and 2015, and the ratio between them
Figure 1. Numbers of papers in SCI that treat of newspaper stories of medical research
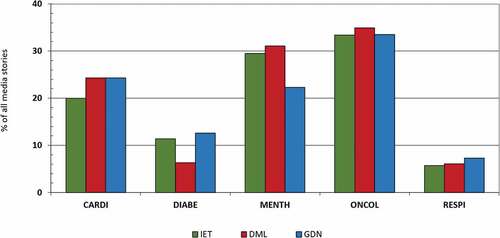
Figure 2. Distribution of media stories between the five non-communicable diseases: IET = Irish Times; DML = Daily Mail; GDN = The Guardian
Figure 3. Comparison of the relative coverage given to the five NCDs in the three newspapers with the relative disease burden from them in the UK and Ireland in 2000–2015
Table 3. Numbers of contributions to stories or cited research papers by journalists, researchers and commentators from three newspapers, males and females, and percentage of females (% F)