
Figures & data
Figure 1. Frequency distribution of weight categories by gender in Brazil
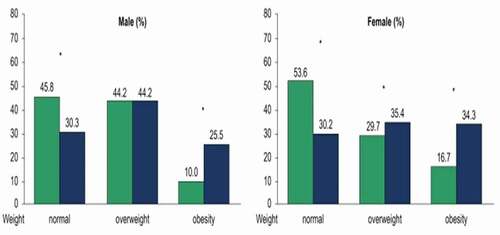
Figure 2. Flow chart of sample selection
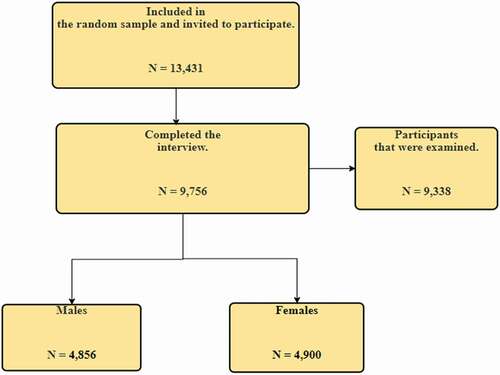
Table 1. Variables and options
Table 2. Sociodemographic Characteristics
Table 3. Overweight response categories by Sociodemographic characteristics
Figure 3. Relationship between overweight and gender demographics
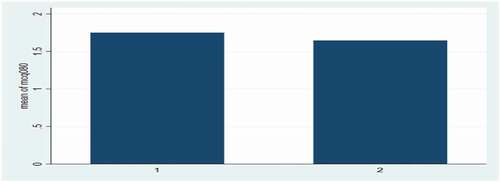
Figure 4. Relationship between overweight and ethnicity demographics
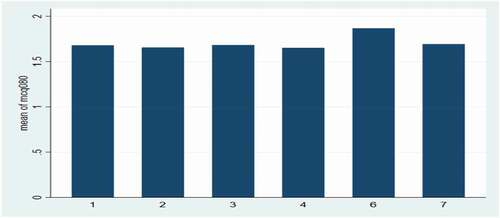
Figure 5. Bar chart showing people who are overweight and whether they have coronary heart disease or not
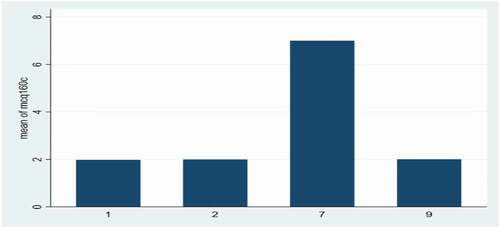
Figure 6. Bar chart showing people who are overweight and whether they have congestive heart failure or not
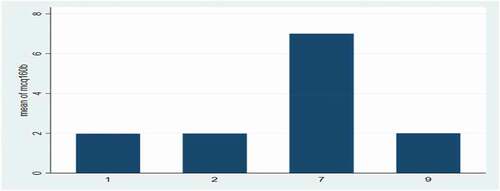
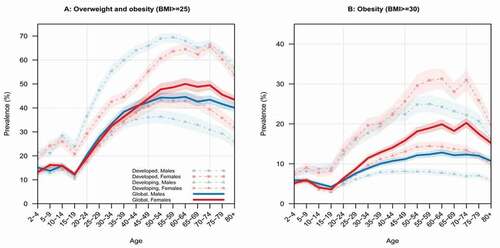
Figure 7. The (Ng et al., Citation2014) study showing the prevalence of overweight and obesity (BMI≥25) and obesity (BMI≥30), by age and sex.
Data availability statement
The data that support the findings of this study are available in National Center for Health Statistics at https://wwwn.cdc.gov/nchs/nhanes/default.aspx. These data were derived from the following resources available in the public domain: https://wwwn.cdc.gov/nchs/nhanes/continuousnhanes/default.aspx?BeginYear=2011.