
Figures & data
Table 1. Pakistan total imports and exports to world and China (million US$)
Table 2. Demonstrates the variables, expected signs and data sources
Table 3. Pesaran’s (Citation2004) CD test
Table 4. Results of gravity model (dependent variable: total trade of Pakistan with FTA partner country)
Figure 1. Results for Pakistan’s trade potential with China.
Source: Authors estimation based on gravity equation 4 results.
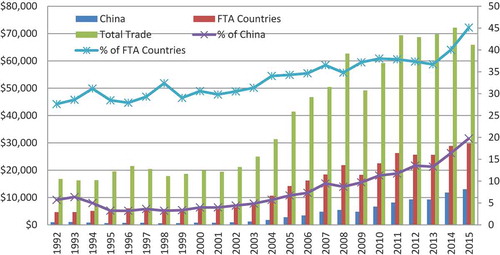
Figure A. Pakistan’s trade with world and FTA countries and percentage share (US$ million).
Source: Authors’ own calculation based on UN Comtrade database and ITC trade map 2017.
Appendix A1. Pakistan’s free-trade agreements with Regional trading blocs and specific countries
Appendix A2. Pakistan’s historical trade share with FTA countries in terms of US$ million
Appendix A3. Pakistan trade composition with the world in the year 2015 (US$ million)
Appendix A4. Pakistan trade composition with China in the year 2015 (US$ million)
Appendix A5. Descriptive statistics of variables used in gravity equation