
Figures & data
Figure 1. (a) GDP per capita and income inequality. (b) Remittances and income inequality.
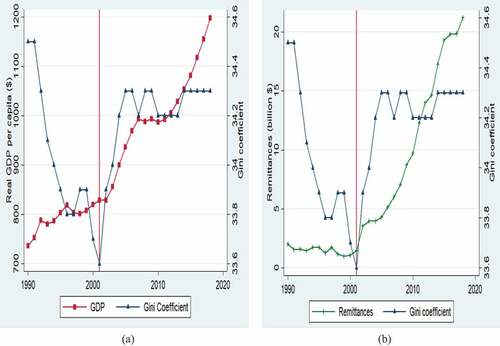
Table 1. Definition of the variables used in analysis
Table 2. Descriptive analysis of variables
Figure 2. (a) Share of external and internal remittances per capita in total household income per capita. (b). Income and expenditure per capita across the household group. (c). Income, expenditure, remittances and non-remittance income in external remittances receiving household. (d). Income, expenditure, remittances, and non-remittance income in internal remittances receiving household.
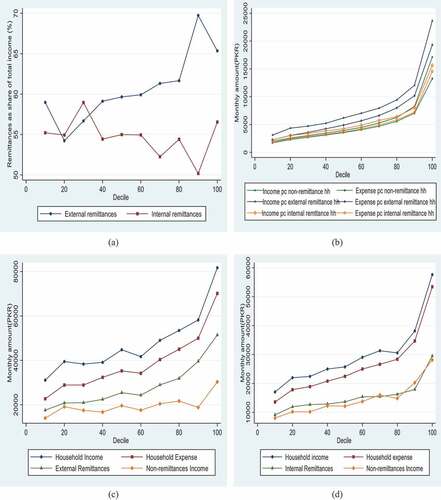
Figure 3. (a).Spatial pattern of expenditure per capita. (b). Spatial pattern of external remittances. (c). Spatial pattern of internal remittances. (d). Spatial pattern of internal vs external remittances.
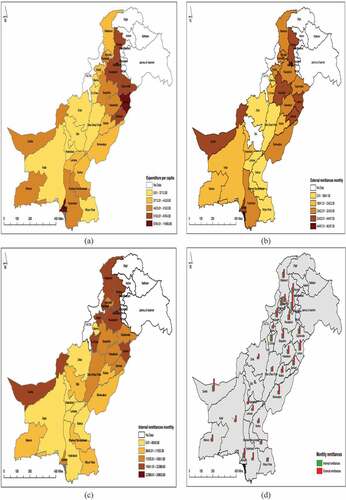
Table 3. Estimates of quantile and OLS regression
Figure 4. Effect of internal and external remittance receipt on expenditure by quantiles.
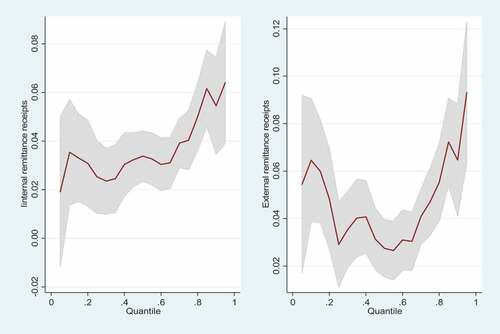
Table 4. Decomposition of inequality in expenditure by using Blinder-Oaxaca decomposition
Table 5. Blinder-Oaxaca Decomposition of differences in mean expenditure per capita
Table 6. Decomposition of unconditional quantile functions
Figure 5. (a)Treatment and endowment effect of external remittance vs no remittance receiving household. (b). Treatment and endowment effect of internal remittance vs no remittance receiving household. (c). Treatment and endowment effect of external remittance vs internal remittance receiving household.
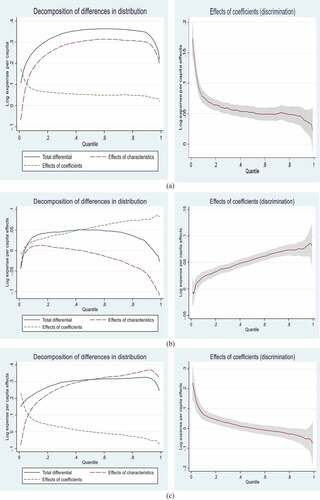
Figure A1. Quantile plot of log expenditure per capita.
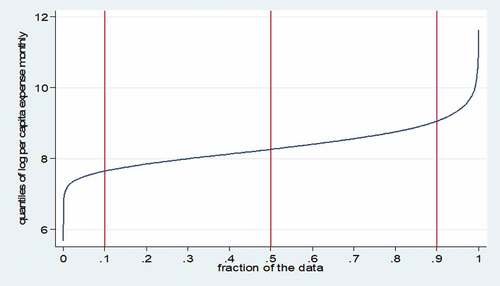
Figure A2. Distribution of expenditure per capita.
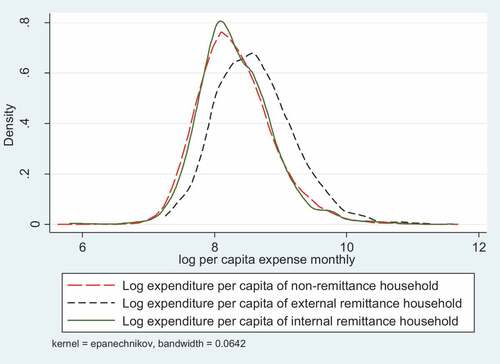
Figure A3. Quantile plot of Expenditure per capita
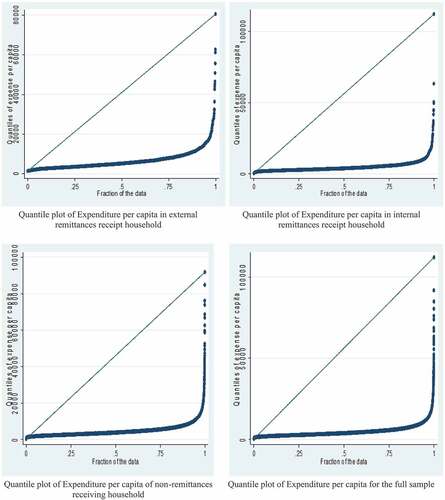
Figure A4. Estimates of quantile regression comparing with the estimates of OLS.
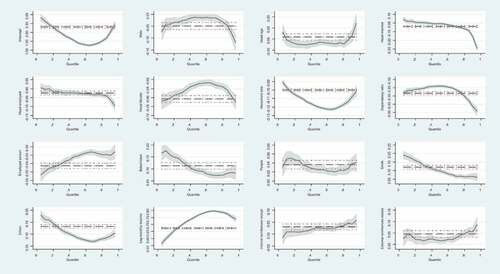
Table A1. Results of quantile regression