Figures & data
Table 1. Summary of Forced Activities from the Expertise of Our Advisory Group.
Figure 1. Or modeling approach and areas where help is needed from trafficking experts. From Sharkey et al. (Citation2021).
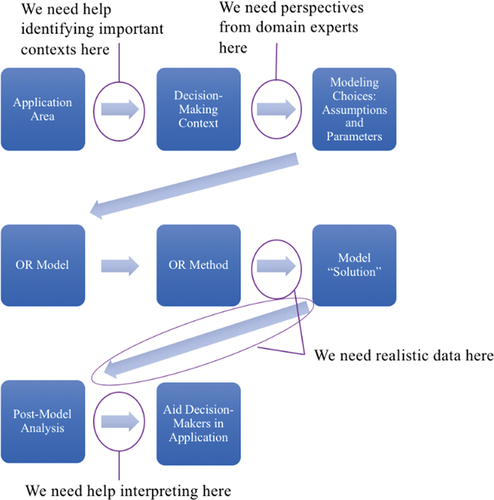
Figure 2. The human trafficking data pyramid. From Kosmas et al. (Citation2023).
Figure 3. An example of control where the trafficker forces the victim to work different illegal activities.
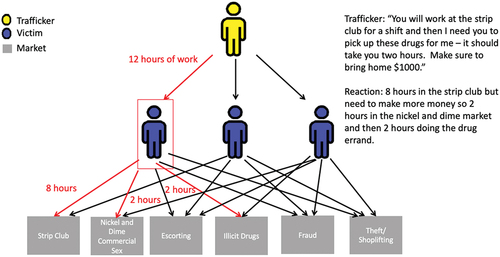
Table 2. An Overview of the Mathematical Notation Capturing the Inputted Data in an Instance of the Interdiction Model.
Table 3. Initial Inputs for Networks with a Nickel and Dime Market Focus and Victims with Substance Abuse Disorders.
Table 4. Initial Inputs for Networks Where Victims Participate in Diverse Commercial Sex Markets.
Table 5. Impacts, in Terms of Fractions, of Interventions on the Available Hours in Each Illegal Market.
Table 6. Input Data into Our Instances and Its Justification.
Table 7. The Number of Hours Victims Were Forced to Work in the Nickel and Dime Market and the Number of Available Hours in the Nickel and Dime Market for Instance 1 of the Six Victim Network Analysis.
Figure 4. Revenues of six victim trafficking networks as the number of interventions increases.
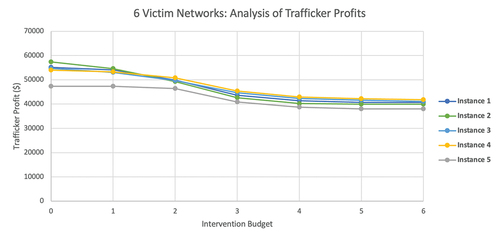
Figure 5. Revenues of five victim trafficking networks as the number of interventions increases.
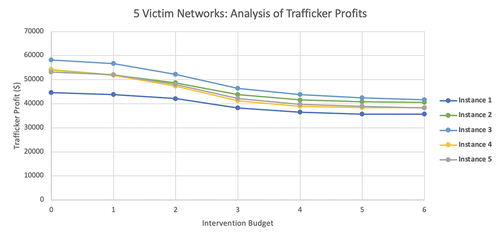
Table 8. Optimal Intervention Strategies as the Budget Increases for All Five Victim Networks and Instances 1, 2, and 5 for Sic Victim Networks.
Figure 6. Percentage changes in forced illegal activities at three interventions for six victim networks.
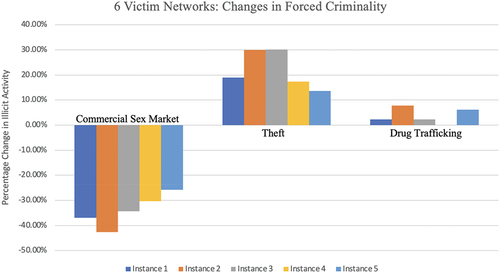
Figure 7. Percentage changes in forced illegal activities at three interventions for five victim networks.
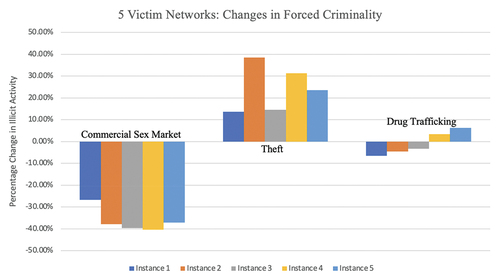
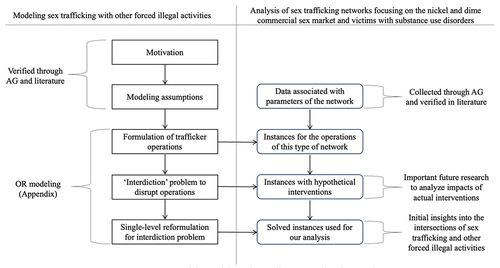
Figure 8. An overview of the modeling, data collection, and analysis in this paper.