
Figures & data
Table 1. Protooth compositions.
Figure 1. Representative morphologic characterization of precipitations formed over Protooth surface immersed in PBS during 56 days. EDX spectrum was obtained from the precipitates in the field of view. Semiquantitative chemical composition presented in the table shows their Ca/P molar ratio.
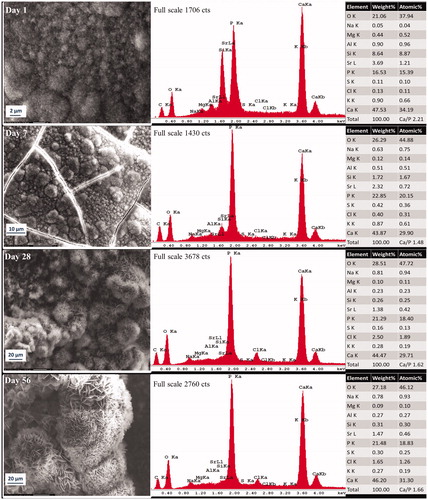
Figure 2. Representative morphologic characterization of precipitations formed over ultrafast Protooth surface immersed in PBS during 56 days. EDX spectrum was obtained from the precipitates in the field of view. Semiquantitative chemical composition presented in the table shows their Ca/P molar ratio.
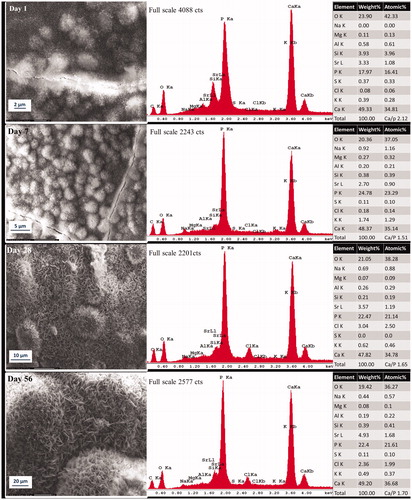
Figure 3. Representative morphologic characterization of precipitations formed over high fluoride Protooth surface immersed in PBS during 56 days. EDX spectrum was obtained from the precipitates in the field of view. Semiquantitative chemical composition presented in the table shows their Ca/P molar ratio.
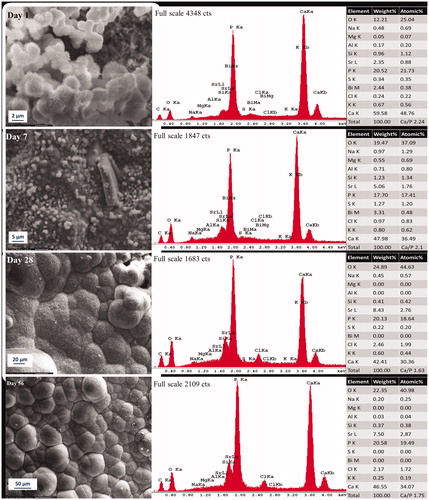
Figure 4. Representative Raman spectra recorded on the surface of Protooth (a), ultrafast Protooth (b), and high fluoride Protooth (c) as the function of immersion time in PBS. The corresponding bands to apatite has been indicated with Ap and C-Ap (β-type carbonated apatite). I965/I860intensity ratio (apatite/belite) obtained from the spectra recorded on the surface of all Protooth compositions immersed in PBS as a function of time (d). A higher intensity ratio is related to thicker apatite deposition. * denotes a significant difference between Protooth and high fluoride Protooth at each time point. § denotes a significant difference between ultrafast Protooth and high fluoride Protooth at each time point. All cements showed statistically significant increase after 56 days compared to day 1 (p < 0.0001).
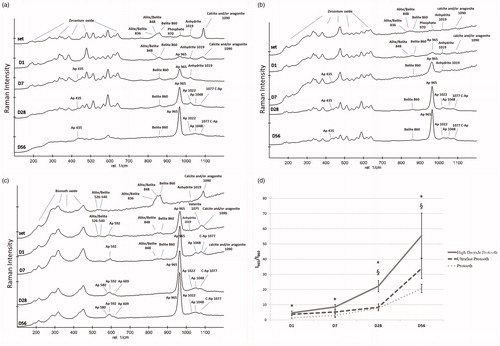
Table 2. Raman shift wavenumbers (cm−1) and bands assignments of apatite recorded on the surface of the cements after 56 days.