
Figures & data
Table 1. Compositions of the composite resin tested.
Figure 1. Mean values of color alteration (ΔE) of the composite resins for all experimental conditions.
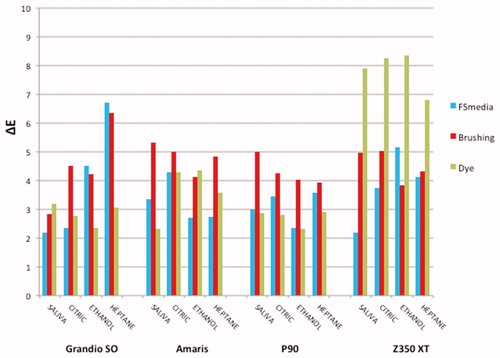
Table 2. Results of color alteration (ΔE) for the composite resins tested.
Table 3. Results of color alteration (ΔE) for food-simulating solutions.
Table 4. Results of color alteration (ΔE), according to the treatments.