Figures & data
Table 1. Forward and reverse sequences of the primers MKD and SobGTFI.
Figure 1. Patent dentine tubules following etching of the dentine surface with 6% citric acid for 90 seconds.
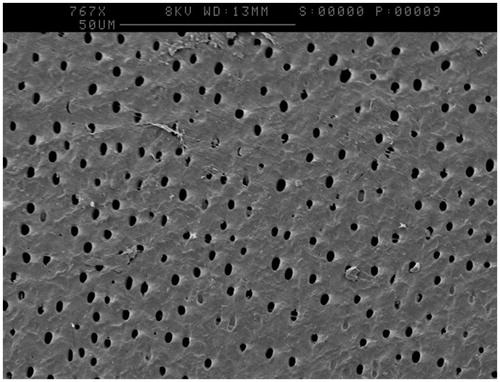
Figure 2. SEM image of a CSPS plus fluoride treated sample following incubation showing occluded tubules and an altered surface layer.
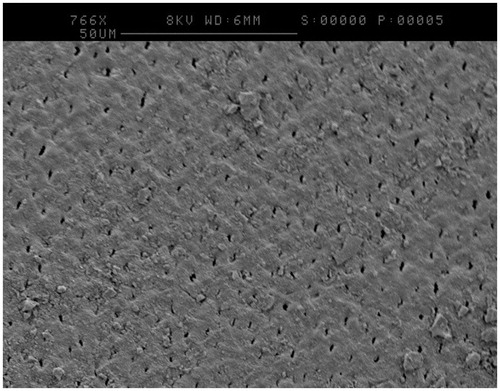
Figure 3. SEM image of a pumice treated sample following intubation demonstrating the formation of an extracellular matrix (highlighted by arrow).
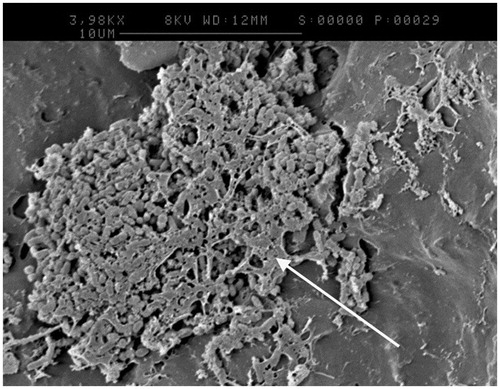
Figure 4. qPCR estimates for the number of S. mutans and S. sobrinus bacteria per a sample. Error Bars represent one standard deviation from the mean.
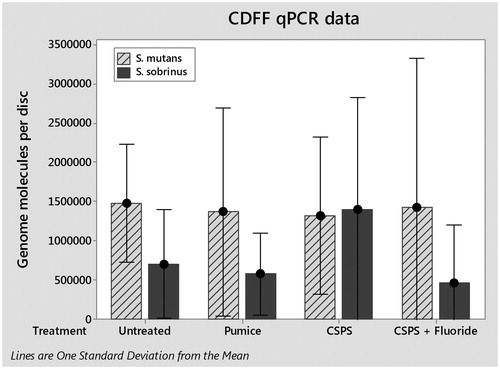
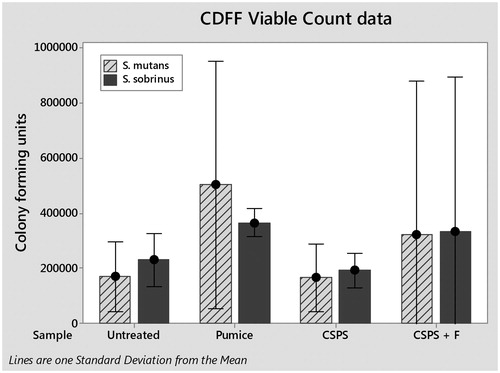
Figure 5. Colony forming units estimated on each sample as the number per a disc for S. mutans and S. sobrinus. Error bars represent one standard deviation from the mean.