
Figures & data
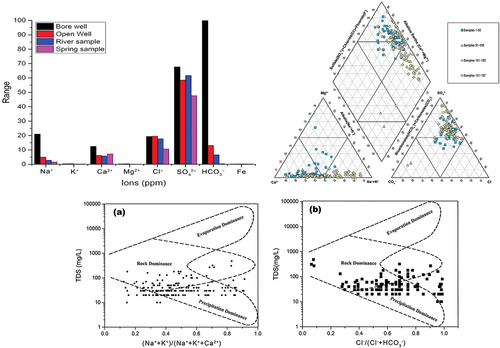
Figure 1. Location map of the study area.
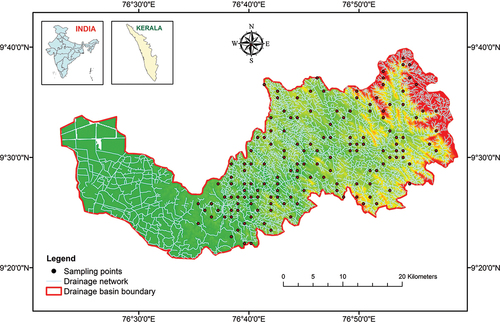
Table 1. Descriptive statistics of physio-chemical parameters of MMRB samples.
Figure 2. Box diagram depicting the concentration of various ions in the water samples of MMRB.
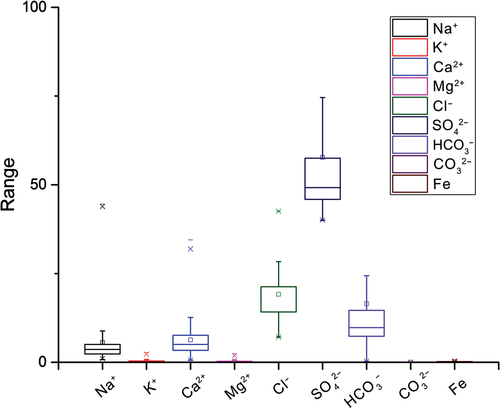
Figure 3. Variation in ionic concentrations (mean value) in water samples.
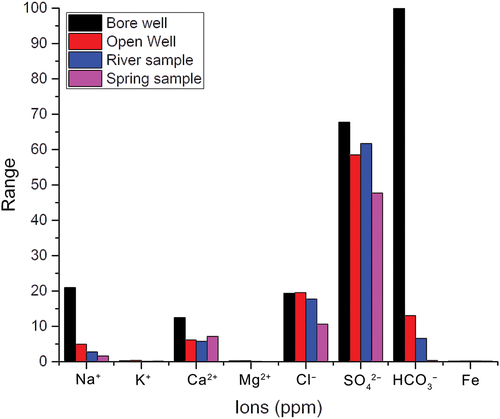
Table 2. Physico-chemical characteristics of water samples.
Figure 4. Hill - Piper trilinear diagram representing the quality of potable water.
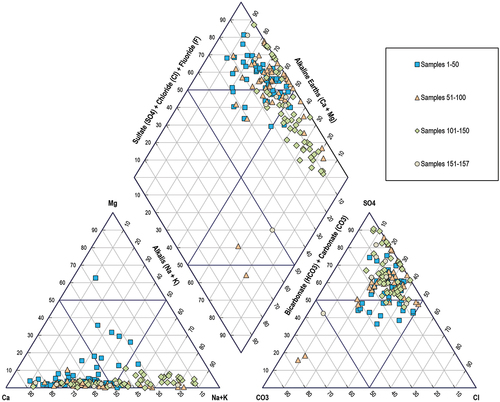
Figure 5. Chaddha diagram representing the quality of water in MMRB.
Table 3. Classification of water samples for its suitability based on for irrigation quality standards.
Figure 6. US salinity chart representing the irrigation water quality of the water samples of MMRB.
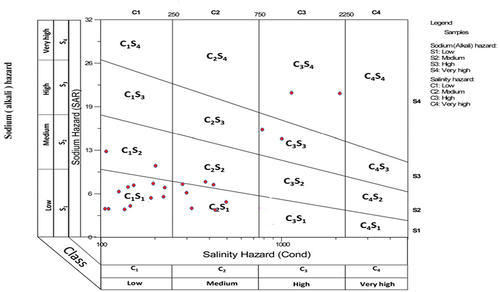
Table 4. Pearson’s correlation matrix of the physical and chemical parameters of MMRB.
Figure 7. A, b. Gibb’s diagram depicting the relation between TDS, cations and anions and interpretation of the mechanism for hydrochemistry of MMRB.
Figure 8. (a) Distribution of Ca2+ + Mg2+ in relation to total cations (TZ) (meq/L), 8 b. Correlation between Na+, and K+ concentrations (meq/L), 8 c. Relationships between Na+ and Cl− in water samples (meq/L) 8 d. SO42- + HCO3− concentration (meq/L) in relation to Ca2+ + Mg2+.
Figure 9. Ca2+ + Mg2+ concentration (mmol/L) and their relation to HCO3−.
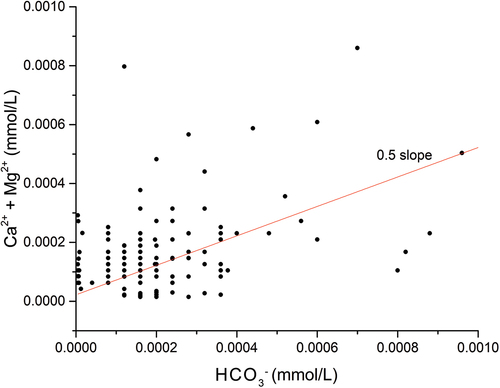
Figure 10. (a) Bivariate analysis of Mg+/Na+ in relation to Ca2+/Na+, and the correlation between Ca2+/Na+ and HCO3-/Na+ () in the water samples, reveals the mixing of ions derived from silicate weathering.
Figure 11. (a) Plot illustrating the relationship between Ca2+ and HCO3- suggests that a majority of the samples exhibit elevated concentration of Ca2+ compared to HCO3-. , depicting the correlation between SO42- and Ca2+ reveals a notable concentration of SO42-in the water samples.
Table 5. Schoeller index of water samples of MMRB.
Table 6. Weight and relative weight of the water samples of MMRB.
Table 7. Water quality index (WQI) classification.
Table 8. Water quality class assessment by fuzzy membership function.
Supplemental Material
Download MS Word (72.5 KB)Data availability statement
Data are included as electronic supplementary material.