
Figures & data

Figure 1. Location of the study area.
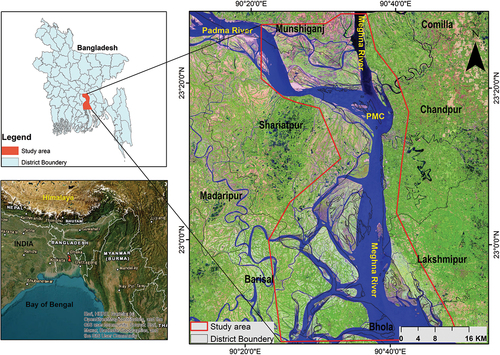
Figure 2. Monthly water discharge flow of the major rivers in Bangladesh (modified after Islam, Citation2016).
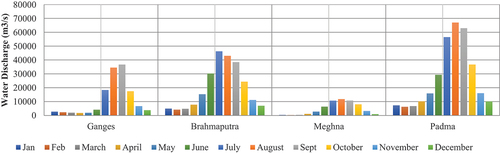
Figure 3. Methodological flowchart.
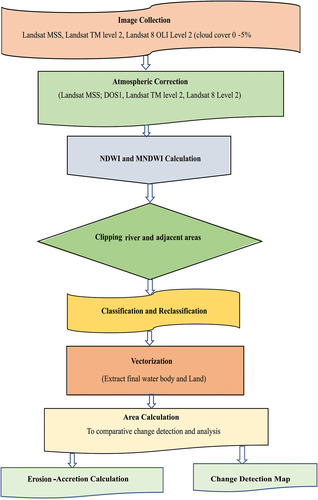
Table 1. Specifications and lists for satellite images used for NDWI and MNDWI (source: USGS, https://earthexplorer.usgs.gov).
Table 2. The erosion and accretion of the bank area and bar over the period of 1973–2021, (-) and (+) value indicate erosion and accretion, respectively.
Figure 4. The figure represents the rivers’ year-by-year changes (a) 1973 and (b)1978, (c) 1989 (d) 1994 (e) 1999, (f) 2004 (g) 2008, (h) 2014, (i) 2019, (j) 2021 (k) 1973 and 2021.
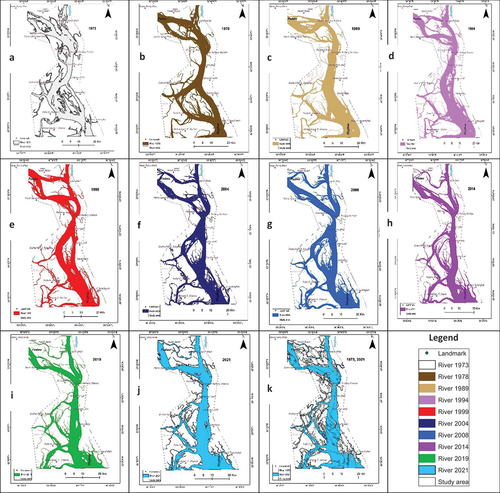
Figure 5. Comparative graph of river and land area in km2 over the period of 1973 to 2021.
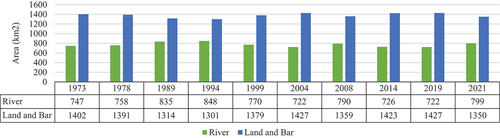
Figure 6. Erosion and accretion of land in the study region from 1973 to 2021, computed using landsat MSS, landsat TM, and landsat 8 OLI NDWI images and MNDWI classified technique.
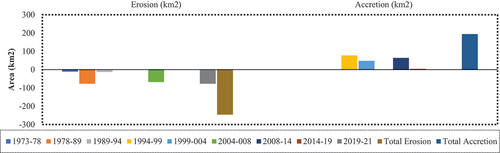
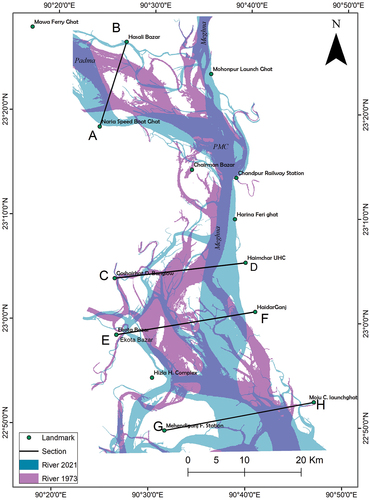
Figure 7. Map showing course of the river from 1973 to 2021, with change dynamics in section AB (A, Naria speedboat station to B, Hasali bazar), CD (C, Goshairhut UPDB to D, Haimchar UHC), EF (E, Ekota bazar to F, Haiderganj), and GH (G, Mehediganj fire station to H, Moju chowdary launch ghat).
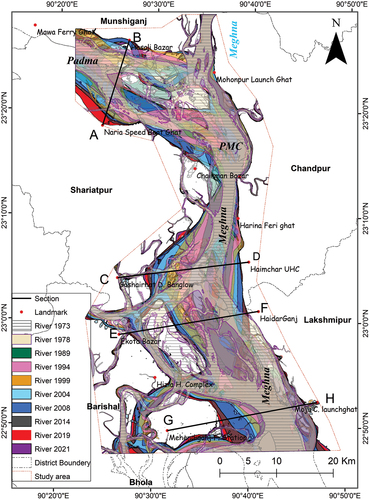
Figure 8. It depicts the Padma river’s left and right bank distances, river width and bar length in different years, along the section AB (see ), from Naria speed boat station to Hasali Bazar.
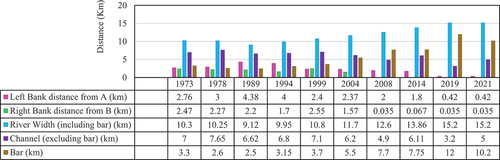
Figure 9. The section CD (see ) depicts the Meghna river’s left and right bank distance, including river width and bar, from goshairhut upazila Parishad Dak Banglo (C) to Haimchar Upazila health complex (D) from the year 1973 to 2021.
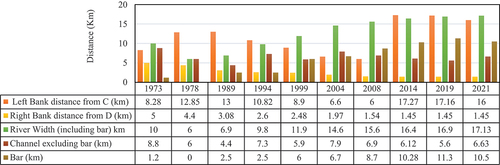
Figure 10. The section EF (see ) depicts the Meghna River’s left and right bank distances including river width and bar, from Ekota Bazar (E) to Haiderganj (F) for the year 1973 to 2021.
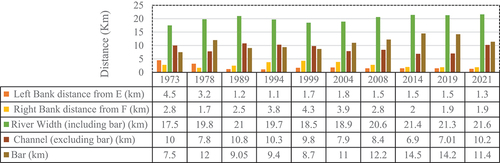
Figure 11. The section GH (see ) shows the left bank and right bank distances, including river width from Mehendiganj fire station (G) to Mojuchowdary launch ghat (H) of the Meghna river for the year 1973 to 2021.
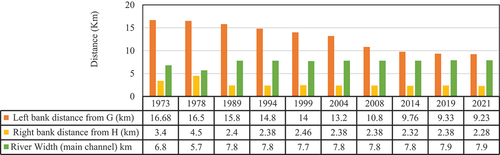
Figure 12. (a) Decadal changes of rivers between 1973–1989, 1989–1999, 1999–2008, and 2008–2021, (b) river rearrangement for better visualization of the changes, layer 2021 in the upper and 1973 in the lower.
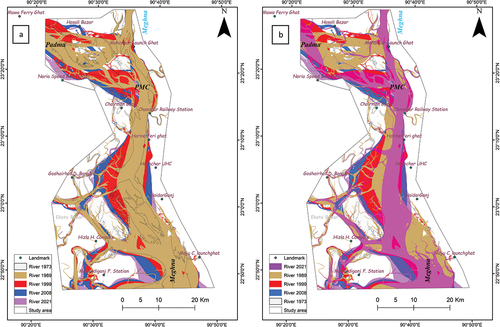
Figure 13. The figure represents the rivers’ year-by-year changes between 1973 and 1978 (a), 1978 and 1989 (b), 1989 and 1994 (c), and 1994 and 1999 (d).
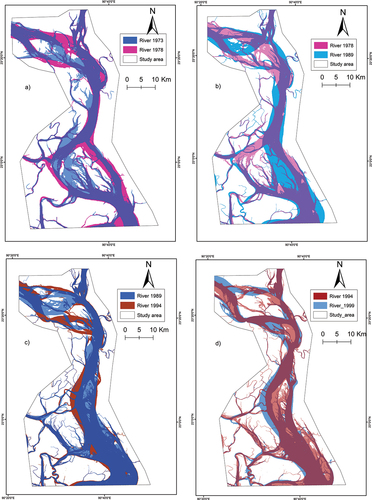
Figure 14. The figure indicates a year-by-year comparison of river changes from 1999 to 2004 (e), 2004 to 2008 (f), 2008 to 2014 (g), 2014, 2019, and 2021 (h).
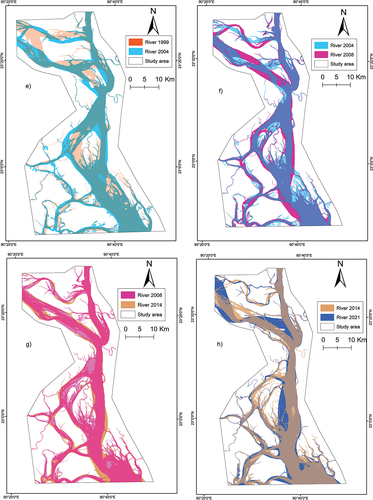
Figure 15. Represent the overall changes of the river between 1973 and 2021, here purple color indicate area common in both of year.
Data availability statement
The data that support the findings of this study are available on request from the corresponding author upon reasonable request.