
Figures & data
Figure 1. Hydraulic conditions of the flow on the weir (Lux, Citation1993).
Figure 2. a) Three-dimensional view, b) Plan and c) Longitudinal profile of trapezoidal labyrinth weir.
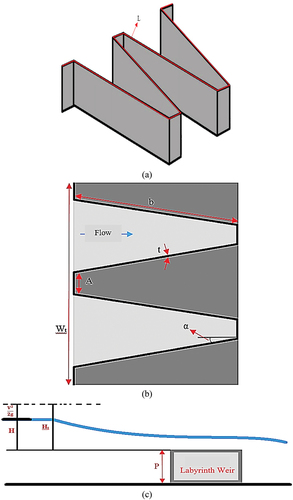
Figure 3. Longitudinal profile and plan of the experimental flume in the current study.
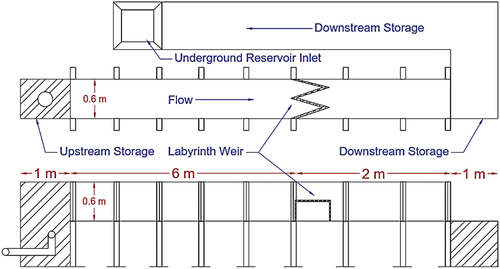
Figure 4. Components of the experimental flume in the current study.
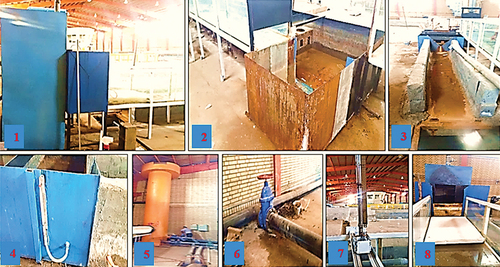
Figure 5. Overview of the experimental flume in the current study (from two different directions).
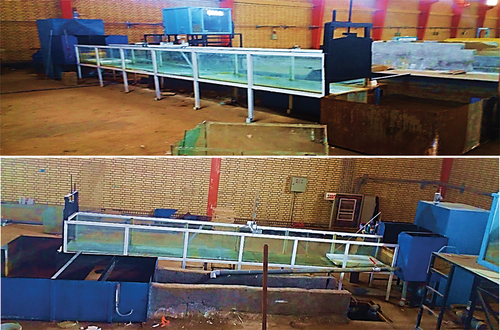
Table 1. Geometrical and hydraulic characteristics of linear and labyrinth, trapezoidal and triangular weirs.
Figure 6. The physical model of linear, labyrinth, trapezoidal and triangular weirs (arc and linear plan) in this study.
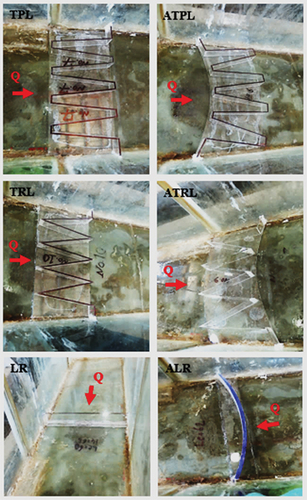
Table 2. Results of measured data and calculations related to ATRL weir energy consumption.
Table 3. Results of measured data and calculations related to TRL weir energy consumption.
Table 4. Results of measured data and calculations related to ATPL weir energy consumption.
Table 5. Results of measured data and calculations related to TPL weir energy consumption.
Table 6. Results of measured data and calculations related to ALR weir energy consumption.
Table 7. Results of measured data and calculations related to LR weir energy consumption.
Figure 7. Variations of Hf/P vs. Ht/P values.
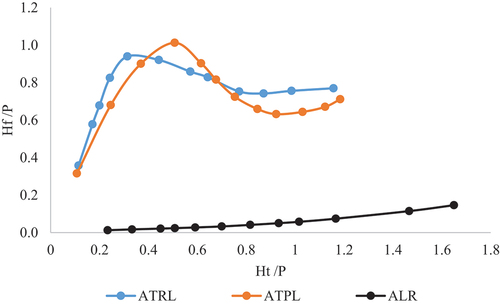
Figure 8. Variation of Cd values against Ht/P.
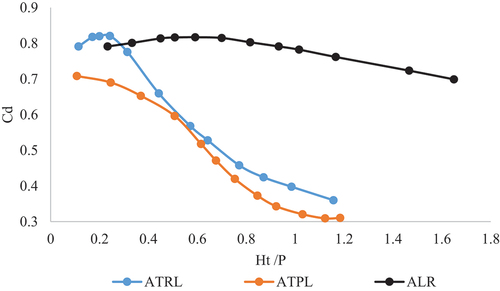
Figure 9. Changes of Hf/P vs. Ht/P.
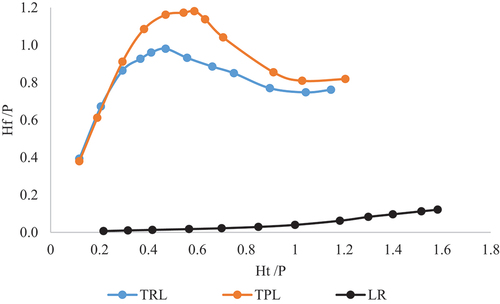
Figure 10. Changes in Cd values against Ht/P.
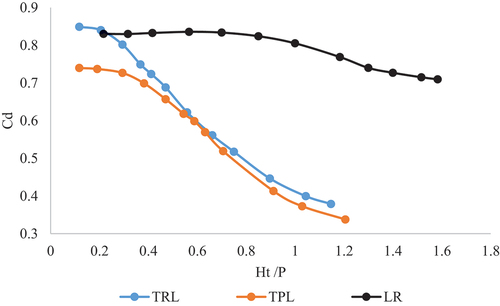
Table 8. Geometrical and hydraulic characteristics of labyrinth weirs in this and other studies.
Figure 11. Comparison of the results of this and other studies.
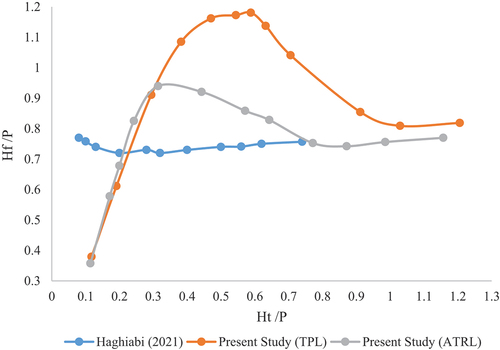
Table 9. Results of measured data for each labyrinth weir.
Table 10. Characteristics of statistical models for each labyrinth weir.