Figures & data
Figure 1. Analysis of APRT and DCK expression on SW620 and HT29 colon cancer cells. A, Cells treated with APRT antibodies experienced no shift in the fluorescent population and had similar fluorescent signatures to isotype controls. B, Cells treated with DCK antibodies experienced an insignificant change in the population when compared to isotype controls, indicating no surface presence. Statistical analysis of APRT and DCK binding reveal insignificant levels of either protein on the surface of SW620 cells. APRT antibodies were mouse and were compared against mouse isotype controls, and DCK antibodies were rabbit and were compared against rabbit isotype controls for statistical analysis. Insignificant shifts in the fluorescent intensity of the cells was observed when treated with both B, APRT and DCK antibodies. Statistical analysis of APRT and DCK binding in HT29 cells showed insignificant levels of the proteins on the surface. C, Insignificant surface binding was also observed in Colo205 cells as well with no shifts in the fluorescent population upon treatment with either APRT or DCK antibodies.
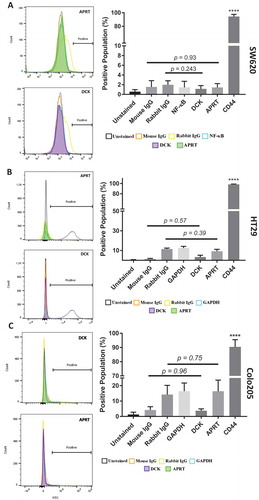
Figure 2. Flow cytometry analysis of HPRT expression on HT29, SW480, and SW620 cells. The following samples were utilized in order to evaluate the expression of HPRT on the surface of CRC cells: Unstained (auto-fluorescence control), Mouse IgG (Non-specific binding control), Rabbit IgG (Isotype control), NF-κB (cytosolic protein control), and CD44 (positive surface antigen). A, When treated with anti-HPRT antibody (pink), the histogram representation of the cell population showed a definitive shift in the population towards a higher fluorescence. Statistical analysis shows significant HPRT binding on the surface of SW620 cells (p value < 0.0001). B, SW480 cells treated with anti-HPRT antibody experienced a shift in fluorescent intensity, indicating HPRT surface localization. Upon statistical evaluation anti-HPRT treated cells show a significant difference when compared to isotype antibody controls (p-value = 0.0095). C, The same fluorescent shift in the population is seen when HT29 cells are exposed to anti-HPRT antibody. There was a shift in the population equivalent to 20%, which is statistically significant from the IgG controls. This indicates that HPRT has significant surface associations in HT29 cells. Statistical analysis shows significant HPRT binding with a p value of 0.0016. There is a significant difference between the levels of HPRT between the cell lines. While HPRT is statistically significant in both cell lines, the difference between the cell line expression is also statistically significant as SW620 cells have over 25% higher expression (p value = 0.0002). D, There was no significant change in the fluorescent population upon HPRT antibody treatment on the surface of Colo205 cells (p-value = 0.99).
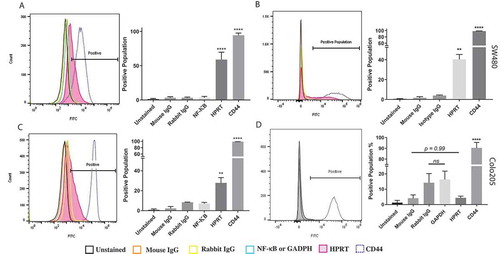
Figure 3. Plasma membrane co-localization of HPRT in SW620 cells. SW620 cells were dyed with both a FITC dye and a Rhodamine Red membrane dye to label antibody treatments and the plasma membrane respectively. Utilizing unstained cells, IgG treated cells, and NF-κB treated cells as controls, plasma membrane associations were evaluated to determine whether any of the treatments significantly bound to the membrane of SW620 cells. A, Each sample was analyzed and imaged by a 488nm laser to illuminate FITC positive cells. These images show the binding of the respective antigen treatment. B, Samples were also imaged in a 594nm laser to show rhodamine positive cells. This dye binds to the plasma membrane of all cells. C, The two images obtained from column A and B were merged to show associations between treated antibodies and the plasma membrane of cells. These results show a clear overlap between cells treated with anti-HPRT antibody and those treated with the membrane dye.
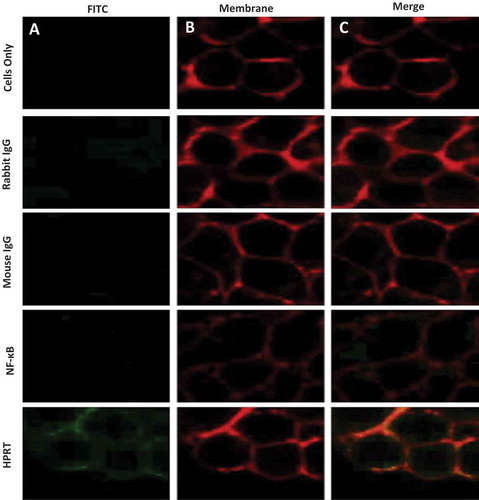
Figure 4. Western analysis of HPRT expression in both cytosolic and membrane fractions. Surface proteins were biotinylated and isolated for analysis. SW620 cell extract, membrane fractions, and cytosolic fractions were probed for HPRT along with a non-biotinylated control. This data shows that there is a very significant presence of HPRT within SW620 cytosol in addition to a clear presence on the surface of the cells.
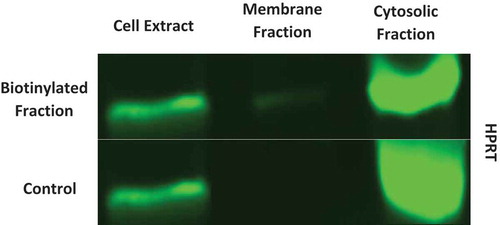
Figure 5. Scanning Electron Microscopy Images and resulting EDAX in HT29 and SW620 cells. Cells were labelled with gold towards their respective antibody treatment. The size scale is shown in each image and represents a 2µm distance. 5a-A & 5b-A, Images were obtained using a Back Scatter Electron (BSE) detector. This detector is specialized to image heavy metals within samples, and highlights enhanced gold within the sample. Any distinguishable large particles of gold represent a bound antibody. 5a-B & 5b-B, Images were also obtained with a Gaseous Side Electron (GSE) detector, which showed cell morphology to ensure correct cell structure and integrity. 5a-C & 5b-C, EDAX analysis of each sample showed the gold elemental peaks for all the elements present within the sample. Silicon is the highest represented element because cells were mounted on silicon cover slips for analysis. The gold elemental peak is indicated with a gold arrow. Images obtained from this analysis show the exact location of the HPRT bound to the surface of the cell, and show no patterns indicating a random distribution of the protein across the surface of the cell.
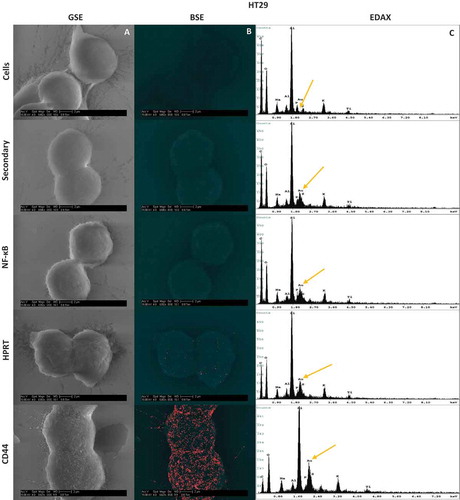
Figure 5. (Continued).
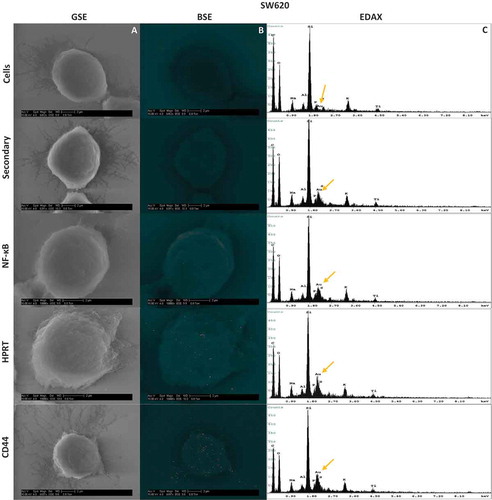
Figure 6. Gold percentage of SW620 and HT29 cells. The gold elemental composition of each sample is denoted on the Y-axis. The increase in the gold percentage when cells were exposed to HPRT and CD44 shows a quantifiable increase in the gold present on the outside of the cell. A, Gold elemental percentages in SW620 cells exposed to HPRT antibody had a gold weight of approximately 11.2%, which is statistically significant to the IgG controls used for background binding (p value < 0.0001). These data indicate a statistically significant presence of HPRT on the surface of SW620 cells. B, Gold elemental percentages in HT29 cells. Gold weight was approximately 10.4% with a p value < 0.0001.
Figure 7. Normal colon tissue stained with HPRT antibodies shows no significant increase in fluorescence. A, Normal colon cells were treated with a variety of antibodies in order to select the correct cell population. Once this population was established, the fluorescent profile of each sample was obtained and graphed. Shown is the unstained control, CD44 positive control, and HPRT. There is a significant shift in the population when cells were exposed to anti-CD44 fluorescent antibodies, but a minimal shift is seen for anti-HPRT treated cells. B, Statistical analysis shows that HPRT had insignificant fluorescent increases when compared to isotype controls. C, These images portray the cell population of interest in quadrant Q3, which are CD45- and PI-, ensuring that cells analysed were not inherit lymphocytes within the tissue or dead cells.
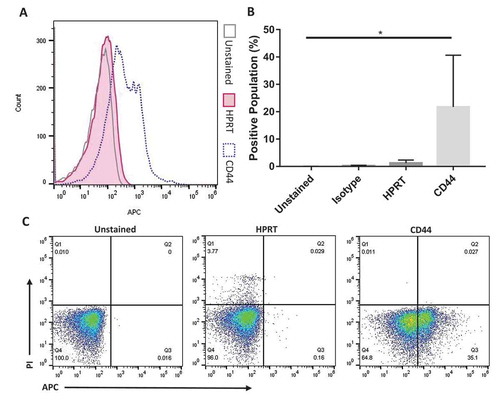
Table 1. HPRT levels within malignant and normal colon tissue.
Figure 8. Evaluation of HPRT expression within patient tissue. All tissues were stained with a monoclonal anti-HPRT antibody. The resulting converted grayscale image is pictured in the top left corner of each image while the grayscale plot is below. A, Tissue from a 79-year-old female patient with stage IIB colon adenocarcinoma and B, tissue from a 48-year-old female patient with stage IV colon adenocarcinoma. These malignant tissues are significantly darker stained than normal colon tissue. C, Normal colon tissue from a 36-year-old male patient and D, tissue from a 31-year-old male patient. These tissues show an upregulation of HPRT within malignant cells.
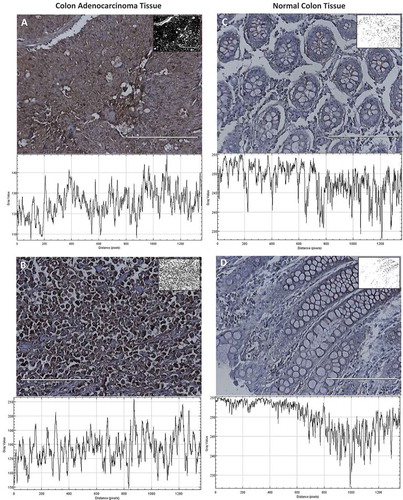
Figure 9. Statistical Analysis of HPRT expression within patient tissue. Quantification of tissue (n = 94) was conducted utilizing a grayscale. The lower the gray value, the darker the tissue is stained. An isotype control was run to establish the gray value of unstained tissue and to account for non-specific antibody binding. There is a statistically significant presence of HPRT in approximately half of the tissues obtained from patients which are labelled as HPRT Cancer Tissue (+). Patient tissue that did not show significant staining are labelled as HPRT Cancer Tissue (-). This increased expression shows that in some patients there is an increased expression of the protein when compared to normal tissue. GAPDH served as a positive control to establish housekeeping levels of staining and showed no statistical difference in expression between normal tissue and cancer tissue. This data indicates that HPRT may be upregulated within some patients and provides insight into how the protein may present on the surface of the cell.
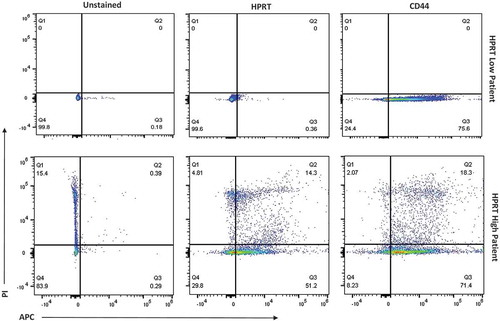
Figure 10. Evaluation of HPRT surface expression in malignant HPRT tissue. Malignant tissue was treated with PI and anti-CD45 antibodies in order to isolate the correct cell population. Upon analzying three separate patients with colon cancer, there were two patients with “HPRT low” tumors and one patient with an “HPRT High” tumor.