Figures & data
Figure 1. Screenshot of VCRI student interface, with Chat-tool (top left), Cowriter-tool (bottom left), Sources-tool (top right) and one opened source (bottom right).
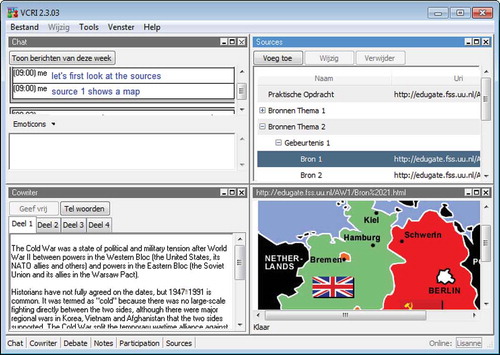
Figure 2. Chat-tool with integrated Concept Trail.
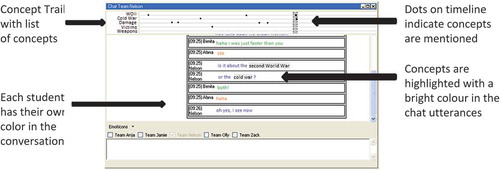
Figure 3. The Progress Statistics tool.
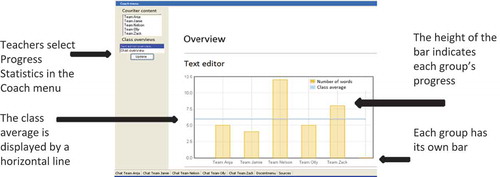
Figure 4. Screenshot of created areas of interests in the VCRI teacher interface, with each marked rectangle representing a different area of interest.
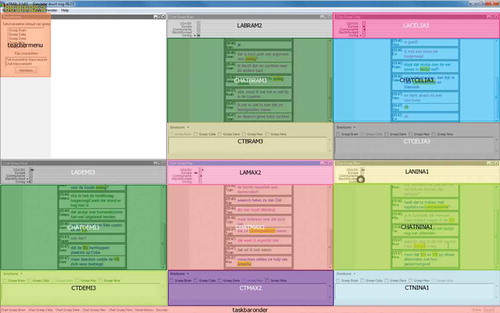
Table 1. Relative fixation duration for the different sources of information for class level and per group.
Table 2. Number of visits and average fixation time per visit (in seconds) for the different sources of information on class level and per group.
Figure 5. Schematic overview of the teacher’s orchestration strategies during the vignette.