
Figures & data
Figure 1. An overview of the planned analyses.
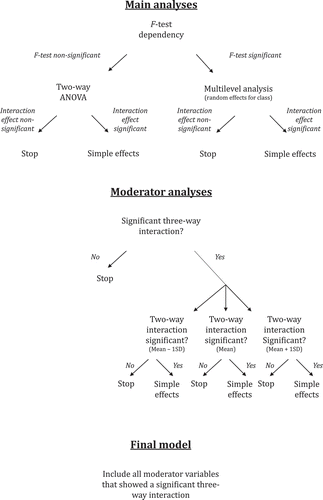
Table 1. Competing hypotheses Bayesian analysis.
Table 2. Interpretation Bayes factors.
Table 3. Averages and standard deviations for math performance (scored in several ways), missing values, math anxiety scale, domain identification, and gender identification.
Table 4. Cohen’s d, Cronbach’s α, greatest lower bound, skewness, and kurtosis.
Table 5. Main analyses: fit measures, deviance, unstandardized regression coefficients, and variance components for models without moderators.
Table 6. Bayes factors for competing hypotheses.
Table 7. Main analyses: fit statistics and model comparison for moderating variables and stereotype threat.
Table 8. Unstandardized regression coefficients for models with moderators estimated with ML.
Table 9. Final model: unstandardized regression coefficients and variance components for final model.