Figures & data
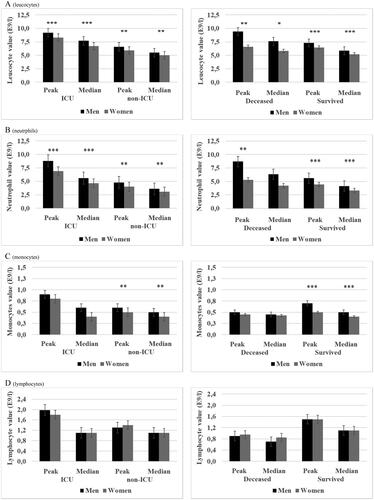
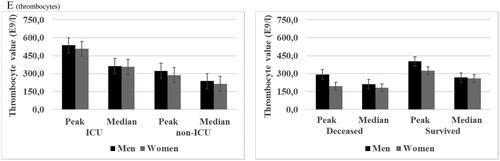
Table 1. Multivariable analysis for parameters of 90-d case-fatality in patients with laboratory-confirmed COVID-19 treated in specialized healthcare hospitals and stratified by sex.
Figure 2. (A–C) Peak and median creatinine and alanine aminotransferase (N = 562) and thromboplastin time (N = 341) for laboratory-confirmed COVID-19 patients in specialized healthcare hospitals stratified by mortality and intensive care unit (ICU) and sub-grouped by sex. ICU patients (N = 132) and deceased patients (N = 68). Data are median (quartiles). ***p Value < .001, **p Value < .01 and *p Value < .05.
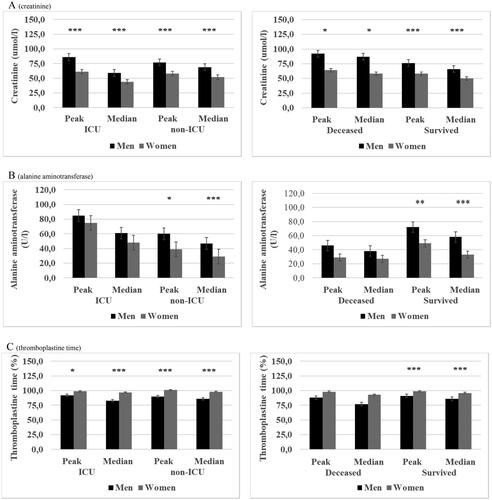
Figure 3. (A–C) Peak and median ferritin (N = 338), d-dimer (N = 356) and C-reactive protein (N = 562) in patients with laboratory-confirmed COVID-19 and treated in specialized healthcare hospitals stratified by mortality and intensive care unit (ICU) and sub-grouped by sex. ICU patients (N = 132) and deceased patients (N = 68). Data are median (quartiles). ***p Value < .001, **p Value < .01 and *p Value < .05.
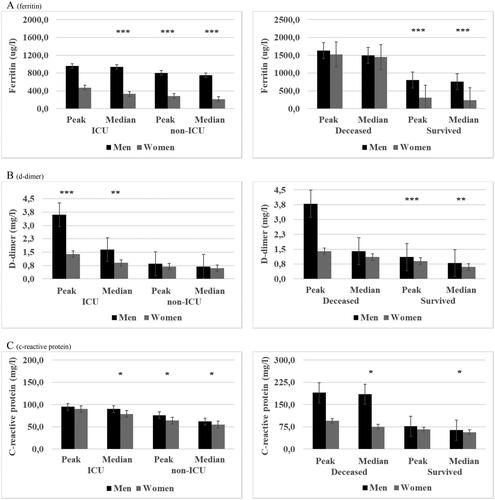
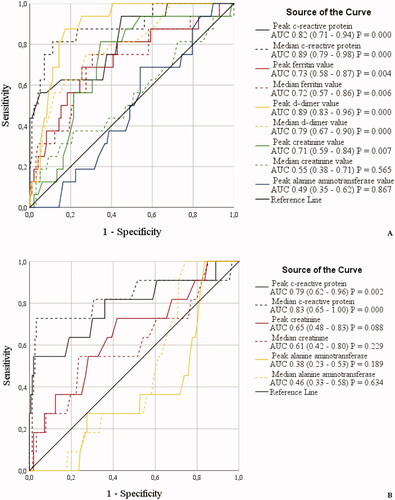
Figure 4. (A,B) Receiver operating characteristic (ROC) curves for associating inflammatory parameters to case-fatality during 90 d follow-up in patients with laboratory-confirmed COVID-19 infection treated in specialized healthcare hospital. Among male (A) COVID-19 patients the ROC analysis was statistically significant for peak and median leucocyte, neutrophil, monocyte, lymphocyte and thrombocyte values: Sensitivity for peak and median values, respectively: leucocytes 62 and 71%, neutrophils 76 and 76%, monocytes 62 and 76%, lymphocytes 81 and 71% and thrombocytes 62 and 62%. Specificity for peak and median values, respectively: leucocytes 59 and 62%, neutrophils 72 and 73%, monocytes 66 and 73%, lymphocytes 70 and 77% and thrombocytes 60 and 63%. Cut-off values for peak and median: leucocytes 7.95 E9/l and 6.65 E9/l, neutrophils 7.05 E9/l and 4.95 E9/l, monocytes 0.55 E9/l and 0.35 E9/l, lymphocytes 1.15 E9/l and 0.85 E9/l and thrombocytes 360 E9/l and 230 E9/l. Among female (B) COVID-19 patients the ROC analysis was statistically significant for peak and median lymphocyte and thrombocyte values: Sensitivity for peak and median, respectively: lymphocytes 77 and 62% and thrombocytes 77 and 69%. Specificity for peak and median, respectively: lymphocyte 69 and 72% and thrombocytes 76 and 68%. Cut-off values for peak and median, respectively: lymphocytes 1.25 E9/l and 0.95 E9/l and thrombocytes 243 E9/l and 215 E9/l.
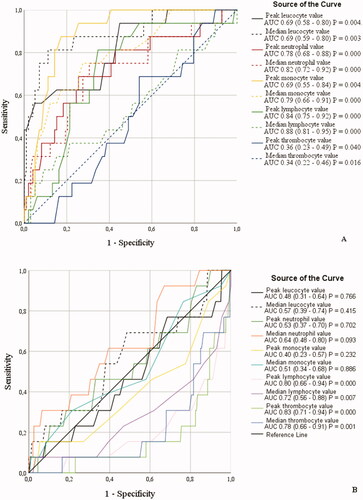
Figure 5. (A,B) Receiver operating characteristic (ROC) curves for associating inflammatory parameters to case-fatality during 90 d follow-up in patients with laboratory-confirmed COVID-19 infection treated in specialized healthcare hospital. Among male (A) COVID-19 patients the ROC analysis was statistically significant for peak and median C-reactive protein, ferritin and d-dimer values and peak creatinine value. Sensitivity, peak and median: C-reactive protein 75 and 88%, ferritin 69 and 69%, d-dimer 88 and 75% and peak creatinine 69%. Specificity, peak and median: C-reactive protein 62 and 76%, ferritin 75 and 72%, d-dimer 83 and 72% and peak creatinine 67%. Cut-off values, peak and median: C-reactive protein 89 and 110 mg/l, ferritin 1347 and 1310 ug/l, d-dimer 2.15 mg/l and 1.15 ug/l and peak creatinine 81 umol/l. Among female (B) COVID-19 patients the ROC analysis was statistically significant for peak and median C-reactive protein and peak creatinine value. Sensitivity, peak and median: C-reactive protein 73 and 82%. Specificity, peak and median: C-reactive protein 70 and 64%. Cut-off values, peak and median: C-reactive protein 87 and 81 mg/l.