
Figures & data
Fig. 1. General description of simulation study.
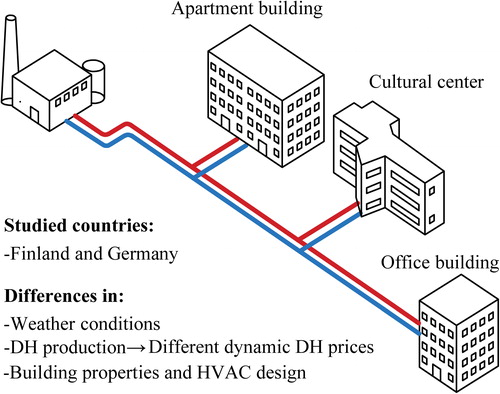
Fig. 2. Flow chart of simulation process.
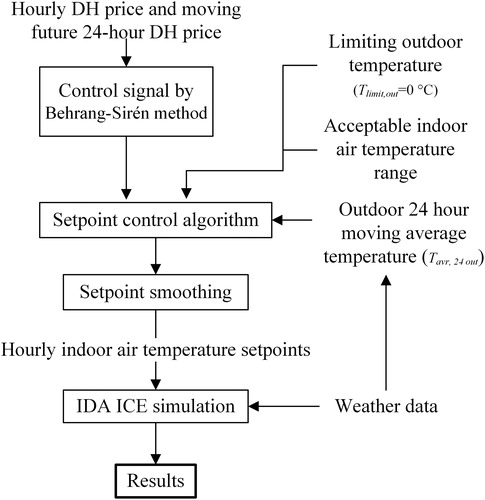
Fig. 3. Finnish and German synthetic DH prices.
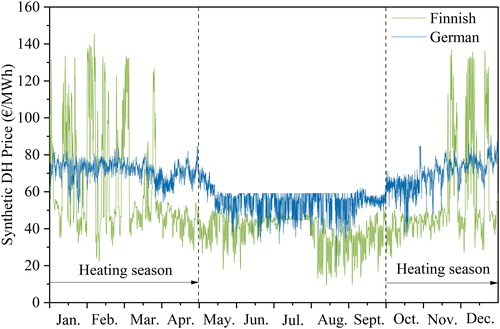
Table 1. Description of the Finnish synthetic DH price.
Table 2. Description of the German synthetic DH price.
Table 3. Description of Helsinki and Hamburg outdoor temperatures of test reference years.
Table 4. Building model parameters.
Table 5. U values and airtightness of buildings.
Fig. 4. Inlet water temperature adjustment in relation to outdoor temperature.
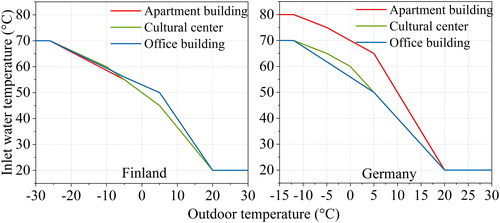
Table 6. Design powers of space heating systems.
Table 7. Ventilation systems for simulated buildings.
Table 8. Usage time and annual internal heat gains.
Fig. 5. Control algorithms 1 and 2 for space heating.
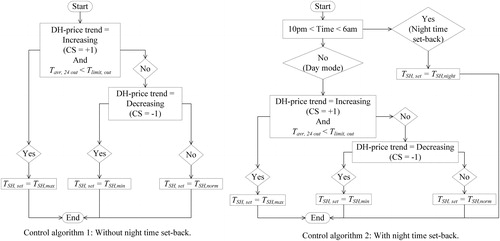
Fig. 6. Smoothed set-points for a day of cases with nighttime set-back.
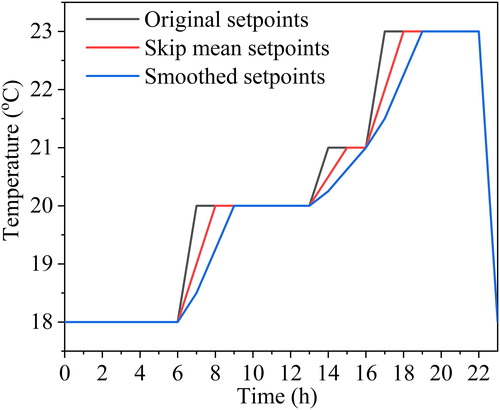
Fig. 7. Charging and discharging energies during increasing and decreasing price trends.
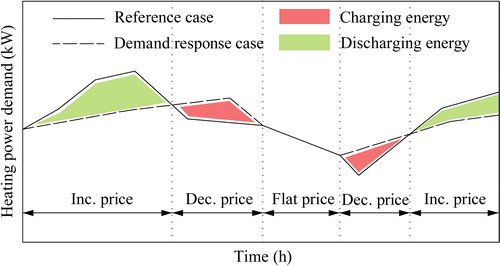
Table 9. Simulation cases for different building types.
Fig. 8. The effect of DR and set-point smoothing on hourly DH power demand.
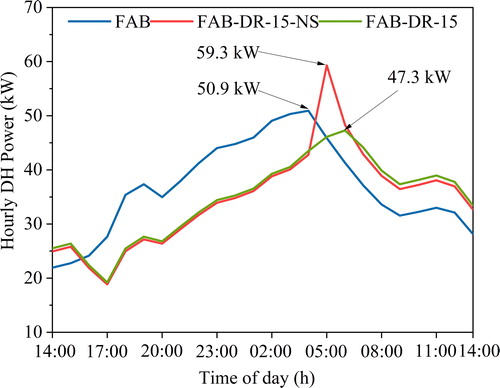
Fig. 9. Set-point variation hours in Finnish cases for each month with marginal value 15 €/MWh.
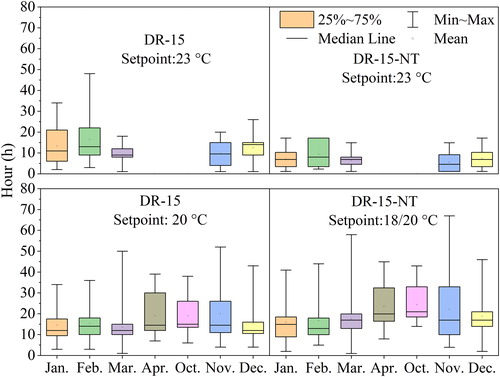
Table 10. Number of total set-point variation hours in Finnish and German cases for each month during the heating season.
Table 11. Number of total set-point variation periods per month in Finnish and German cases during the heating season.
Fig. 10. Variations of charging/discharging energies during a single charging/discharging period in the Finnish apartment building (FAB), cultural center (FCC), and office building (FOB) with marginal values of 15 €/MWh and 75 €/MWh.
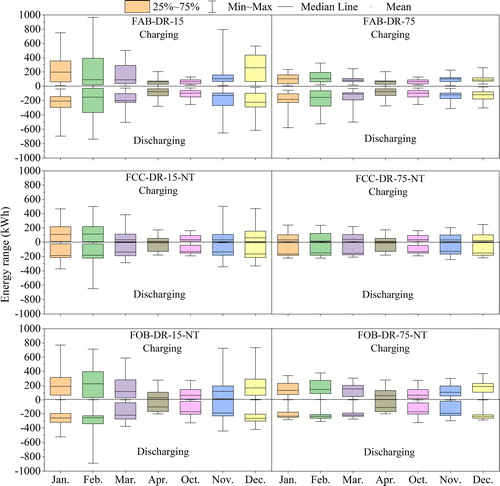
Table 12. Total specific charging and discharging energies of the Finnish cases per heated net floor area.
Fig. 11. Variations of charging/discharging energies during a single charging/discharging period in the German apartment building (GAB), cultural center (GCC), and office building (GOB) with marginal values of 15 €/MWh and 75 €/MWh.
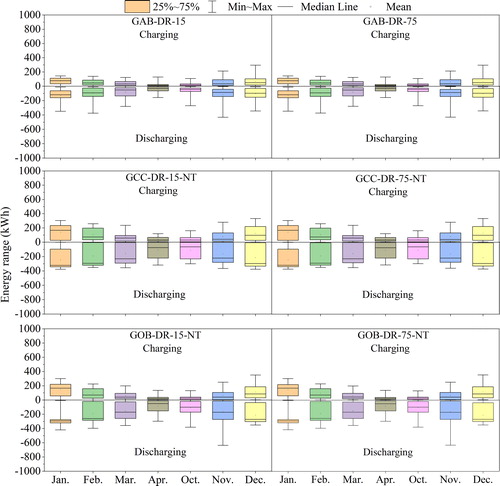
Table 13. Total specific charging and discharging energies of the German cases per heated net floor area.
Fig. 12. Power flexibility factors P+ and P− of the Finnish office building without and with nighttime set-back.
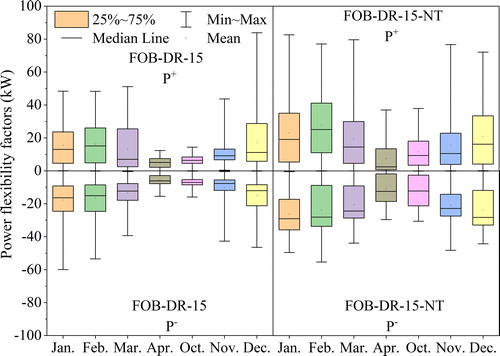
Fig. 13. Hourly heating power demand with (red line) and without (blue line) nighttime set-back in the Finnish office building.
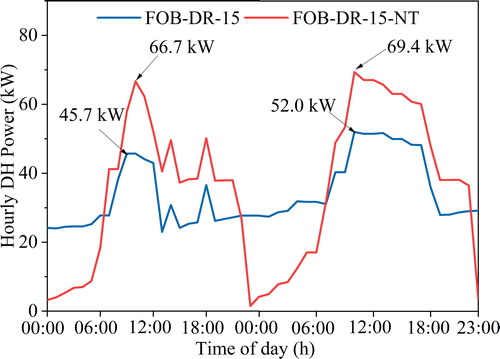
Table 14. Flexibility factors and average indoor temperature of Finnish and German cases.