
Figures & data
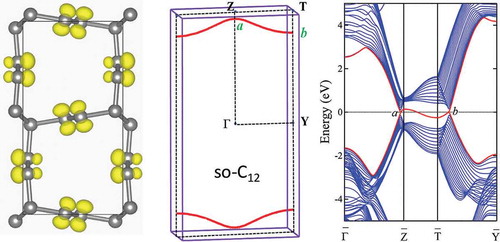
Figure 1. (a) Electronic band structure of 2D graphene along several high-symmetry directions of G-M-K-G. (b) Dirac cone formed by the valence and conduction band in the vicinity of the Dirac point . (c) Rectangular 6,6,12-graphyne in
symmetry with lattice parameters
= 9.4980 Å,
= 6.7323 Å, and its 2D BZ. (d) Electronic band structure of 2D 6,6,12-graphyne along with the high-symmetry directions of G-X-S-Y-G.
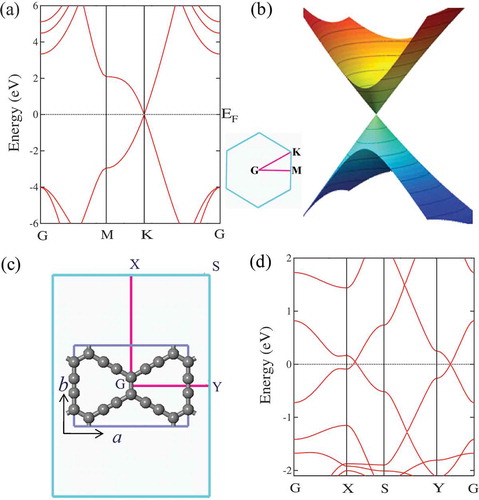
Figure 2. (a) Schematic depiction of the structure of MTC. (b) Bulk and (001)-surface BZ, as well as the highly symmetrical points. (c) Band structure from the first-principles calculation. The two triply degenerate eigenstates at
and R with
and
symmetrical representation are marked. The band inversion between them can be easily seen. (d) The Fermi surface consists of three lotus-root-like rings from the tight-binding calculation. These rings are center the R point and are parallel to the
,
, and
plane, respectively. They are formed by the electron pockets (blue) and hole pockets (red) connected by nodal points at the Fermi energy.
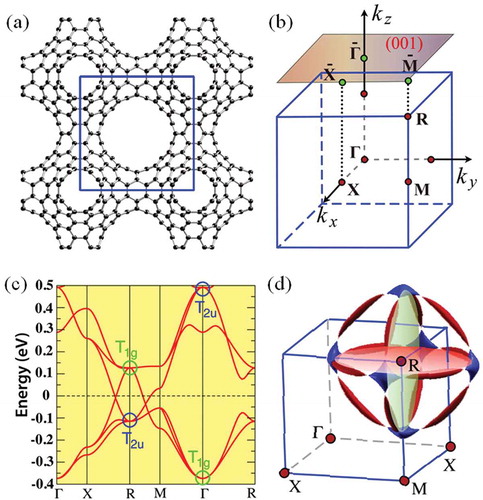
Figure 3. The (001)-surface state of MTC. (a) The nearly flat surface band is nestled between two solid Dirac cones, which are the projection of one of the node-line circles as indicated in the inset (red circle). The other two node-line rings are projected as two orthogonal diameters (green line). (b) The surface density of state. (c) The wave function of the surface state indicated by the arrow decays rapidly into bulk. (d) The eigenenergy distribution of a surface flat band nestled inside of a projected node-line circle, which looks like a vibration model of a drumhead. The mixing of surface and bulk states leads to discontinuity in this plot.
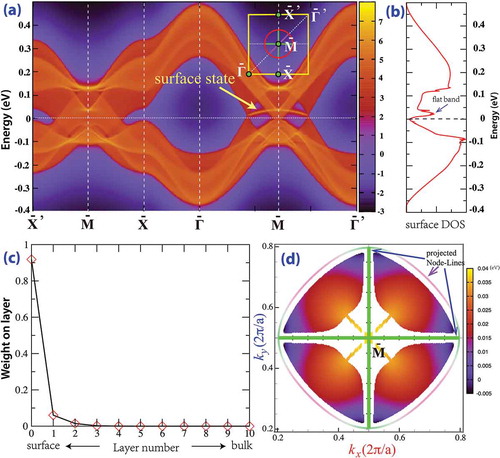
Figure 4. Structure of bco-C and its phonon dispersion. (a) Top and side view of the all-
bco-C
in
(
) symmetry with one-third double (
,
) and two-thirds single (
) C-C bonds. It has a 16-atom body-centered orthorhombic structure with lattice parameters
= 7.8061 Å,
= 4.8772 Å,
= 3.2372 Å, occupying the
(0.3231, 0.25, 0.1258) and
(0.0885, 0.5, 0.5) Wyckoff positions, denoted by C
and C
, respectively. (b) Calculated phonon dispersion curves of bco-C
at zero pressure.
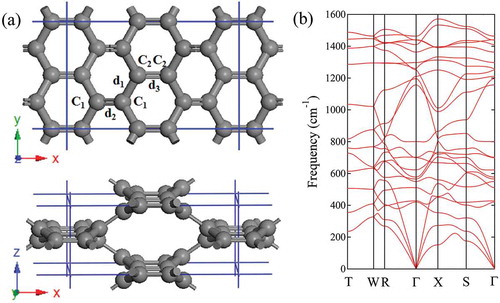
Figure 5. Calculated bulk and surface band structures of bco-C at equilibrium lattice parameters. (a) The bulk band structure along several high-symmetry directions. G
and G
indicate the irreducible representation of the two crossing bands, respectively. (b) The BZ with several high-symmetry momenta indicated. The nodal ring (red circle), formed by the band crossing points, is in the shaded mirror plane. (c) and (d) show the surface states for different zigzag-like (c) and beard-like (d) terminations of the (100) surface. The surface flat band (red line) can be outside or inside the surface-projected nodal ring.
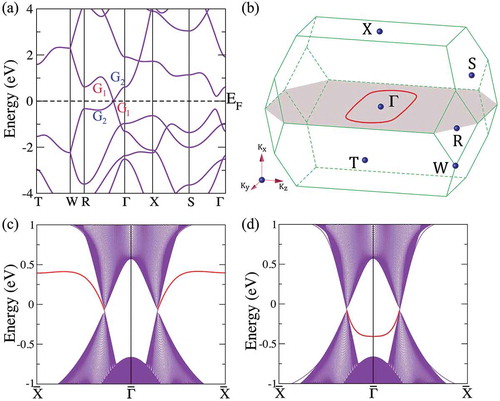
Figure 6. X-ray diffraction (XRD) patterns. (a) Simulated XRD patterns for graphite, diamond, rh6, cT8, cR6, fcc-C, and bco-C
. (b) Experimental XRD patterns for detonation soot of TNT/diesel oil [Citation82] and chimney soot [Citation83]. X-ray wavelength is 1.5406 Å with a copper source.
![Figure 6. X-ray diffraction (XRD) patterns. (a) Simulated XRD patterns for graphite, diamond, rh6, cT8, cR6, fcc-C 60, and bco-C 16. (b) Experimental XRD patterns for detonation soot of TNT/diesel oil [Citation82] and chimney soot [Citation83]. X-ray wavelength is 1.5406 Å with a copper source.](/cms/asset/855df80f-5803-421c-ad44-9abe43470db7/tapx_a_1625724_f0006_oc.jpg)
Figure 7. (a) The crystal structure of so-C in
(
) symmetry with lattice parameters
= 4.313 Å,
= 8.604 Å, and
= 2.461 Å, occupying the 4
(0.0507, 0.2104, 0.25), 4
(0.0763, 0.0351, 0.25), and 4
(0.5783, 0.5052, 0.25) Wyckoff positions denoted by C
, C
and C
, respectively. (b) Phonon band structures and partial density of states (PDOS) for so-C
. The peaks around 1443 cm
and 1268 cm
are related to
and
bonding, respectively.
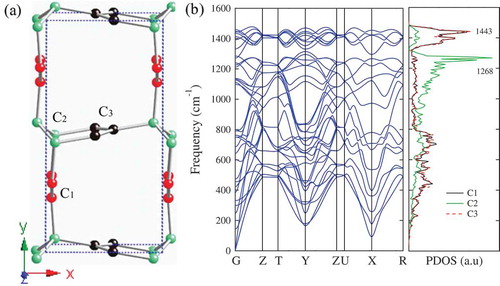
Figure 8. (a) A double cell reconstruction pathway from polymeric (3,3) CNT toward so-C with bond breaking between atoms 6–7 and 16–17 at step-9 and between atoms 1–12 and 22–23 at step-13. The atoms are marked as red in tube-I and black in tube-II, respectively. (b) Enthalpy versus pathway from polymeric (3,3) CNT toward so-C
at 10 and 15 GPa.
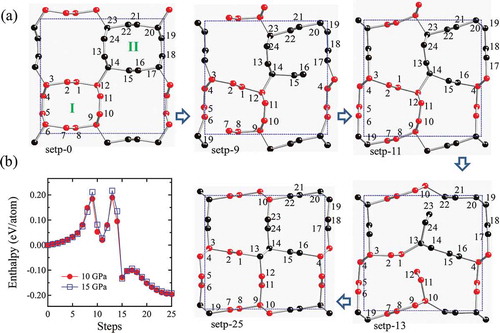
Figure 9. Calculated bulk and surface band structures of so-C at equilibrium lattice parameters. (a) The bulk band structure along several high-symmetry directions. G
and G
indicate the irreducible representations of the two crossing bands, respectively. (b) The BZ with several high-symmetry momenta indicated, and the nodal lines (red), formed by the band crossing points, in the G-Z-T-Y mirror plane. The
and
points represent the nodal point located along G-Z and T-Y line, respectively. (c) The band-decomposed charge density isosurfaces (0.07
/Å
) around the nodal point
along T-Y direction in BZ. (d,e) The (010) surface states obtained using a ten-layer-thick slab geometry along the [010] direction. The surface flat band (red line) can be inside or outside the surface projected nodal lines, depending on the termination of the surface without (d) or with (e) saturation by hydrogen atoms. The projected surface BZ
-
-
-
is marked relative to G-Z-T-Y in bulk in (b). (f) Partial charge density isosurfaces (0.05
/Å
) related to the (red) surface bands in (d) at the
point. The outermost atoms are C
and C
with dangling bonds on C
sites.
![Figure 9. Calculated bulk and surface band structures of so-C 12 at equilibrium lattice parameters. (a) The bulk band structure along several high-symmetry directions. G 1 and G 2 indicate the irreducible representations of the two crossing bands, respectively. (b) The BZ with several high-symmetry momenta indicated, and the nodal lines (red), formed by the band crossing points, in the G-Z-T-Y mirror plane. The a and b points represent the nodal point located along G-Z and T-Y line, respectively. (c) The band-decomposed charge density isosurfaces (0.07 e/Å 3) around the nodal point b along T-Y direction in BZ. (d,e) The (010) surface states obtained using a ten-layer-thick slab geometry along the [010] direction. The surface flat band (red line) can be inside or outside the surface projected nodal lines, depending on the termination of the surface without (d) or with (e) saturation by hydrogen atoms. The projected surface BZ Gˉ-Zˉ-Tˉ-Yˉ is marked relative to G-Z-T-Y in bulk in (b). (f) Partial charge density isosurfaces (0.05 e/Å 3) related to the (red) surface bands in (d) at the Gˉ point. The outermost atoms are C 2 and C 3 with dangling bonds on C 2 sites.](/cms/asset/3635a375-2f8f-4494-bade-34d92c55c8e9/tapx_a_1625724_f0009_oc.jpg)
Figure 10. (a) Berry phase with a closed loop surrounding one of the nodal lines. (b) Berry phase using two lines (the black dash lines) in direction passing through the BZ inside or outside between two separated nodal lines. The result is either
or
.
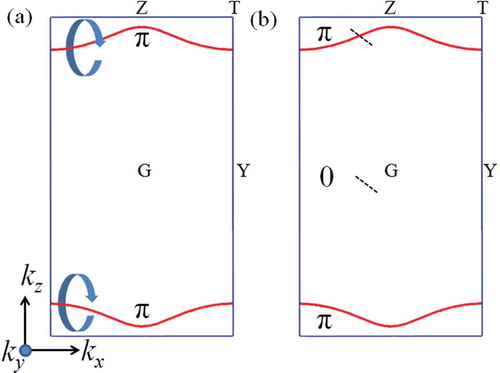
Figure 11. (a) The 40-atom unit cell of bct-C with lattice parameters a = 12.9012 Å, c = 2.4599 Å, occupying the 8
(0.7257, 0.7257, 0.5), 16
(0.7370, 0.6096, 0.5), and 16
(0.7615, 0.0558, 0.5) Wyckoff positions denoted by C
, C
and C
, respectively. (b) A 20-atom primitive cell of bct-C
viewed as a crystalline modification of the (5,5) CNT.
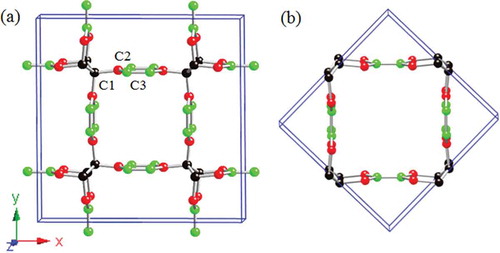
Figure 12. Calculated bulk and surface band structures of bct-C. (a) The bulk band structure along several high-symmetry directions.
and
indicate the irreducible representations of the two crossing bands, respectively. (b) The bulk BZ with several high-symmetry points indicated at G(0.00, 0.00, 0.00); X(0.00, 0.00, 0.50); P(0.25, 0.25, 0.25); N(0.00, 0.50, 0.00); Z(−0.50, 0.50, 0.50); L(0.26, 0.26, −0.26), and A(−0.26, 0.74, 0.26). (c) Two symmetric-boxed-asterisk shaped nodal nets (red lines) formed by several nodal lines is in the high symmetric mirror plane. (d) and (e) show the (100) surface band states. In (e), the surface dangling bonds are saturated with hydrogen atoms. There are two coupled surface flat bands with one occupied and the other unoccupied around the Fermi level.
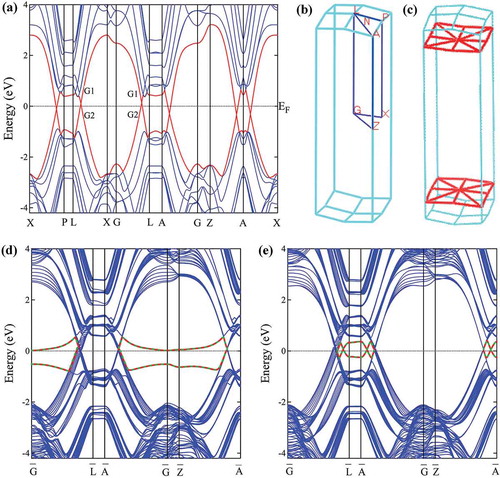
Figure 13. Calculated energy versus volume per atom for various carbon allotropes in all- or mixed
-
bonding networks. The detailed structures are described in text.
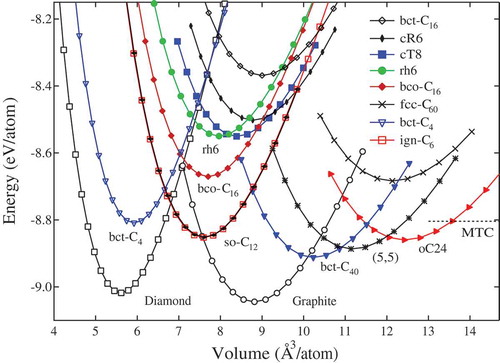
Table 1. Calculated equilibrium structural parameters (space group, volume , total energy
, bulk modulus
, and HSE06 electronic band gap
for MTC [Citation59], bco-C
[Citation62], bct-C
[Citation64], ign-C
[Citation60], oC24 [Citation65], so-C
[Citation67] and bct-C
[Citation68] in all-
or
-
hybrid networks compared to diamond, and other all-
carbon phases including graphite, fcc-C
[Citation81], and three chiral framework structures cR6 [Citation2], cT8 [Citation2], rh6 [Citation6] at zero pressure, compared to available experimental data [Citation4].