Figures & data
Figure 1. (a) inception times (ns) for N = 5 (purple), 10 (green), 15 (cyan), 20 (orange), 25 (yellow), 30 (blue), 35 (red) and 40 (black) as a function of the temperature for a system containing 50% Si and 50% Ar (C1). Inception time for a cluster of size N is defined as the minimum time at which this cluster appears in the simulation box during the dynamics. (b) function aP(N) (in arbitrary units, for a definition of this function, refer to Equation (1)–(2) for the two different compositions: C1 (purple dots) and C2 (blue triangles).
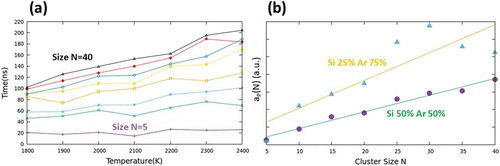
Figure 2. (a) evolution of the number of atoms during the simulation for two characteristic clusters of finite size 86 Si atoms (green line) and 115 Si atoms (red line); the simulation has been carried out at P = 1.00 atm and T = 2000 K in a mixture made of 25% Si and 75% Ar. (b) Sintering plot for two particles made of about 1000 atoms (radius about 1.7 nm) on a temperature range between 1000 and 1500 K; initial and final structures (cyan balls).
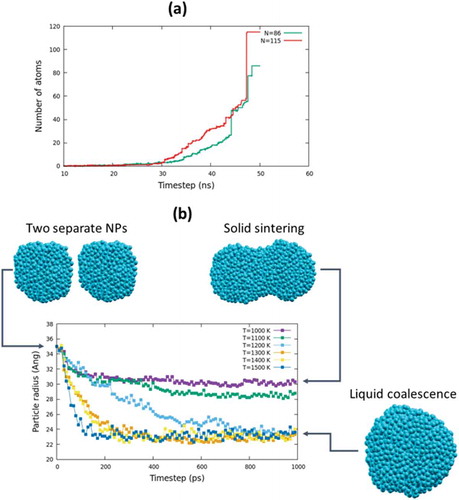
Figure 3. (a) Si20 surrounded by 10 H2 molecules; (b) Si20 surrounded by 10 H2 molecules and one Si dimer in its final configuration where the dimer has adsorbed on the bigger cluster in the form of Si2H4 species; starting (c) and final (d) configuration of 3 Si dimers surrounded by 3 H2 molecules: in the final configuration the three dimers have coalesced in a Si6 cluster. PBC cubic boxes are visualized to give an idea of the concentration of the species. Si and H atoms are cyan and yellow, respectively.
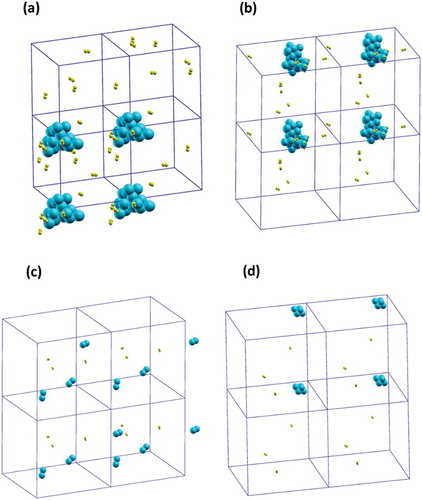
Figure 4. (a-b) Si particle made of 1000 atoms surrounded by 187 H2 molecules; after 1 ns only one molecule was physisorbed and two H atoms chemisorbed on the cluster surface; (c-d) Si particle made of about 100 atoms surrounded by 30 H2 and 30 N2 molecules; after 2 ns the particle was covered with six chemisorbed hydrogens but no N atoms were found on the surface. Si, H and N atoms are cyan, yellow and blue, respectively.
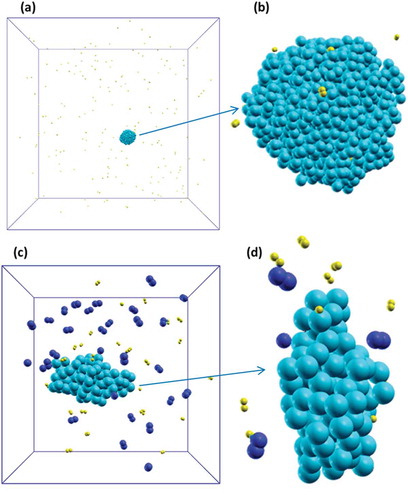
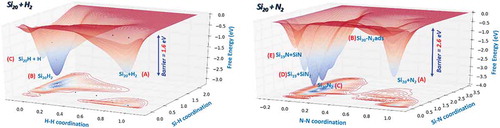
Figure 5. Left panel: DFTB free energy surface of the Si20 + H2 system. Right panel: DFTB free energy surface of the Si20 + N2 system.