Figures & data
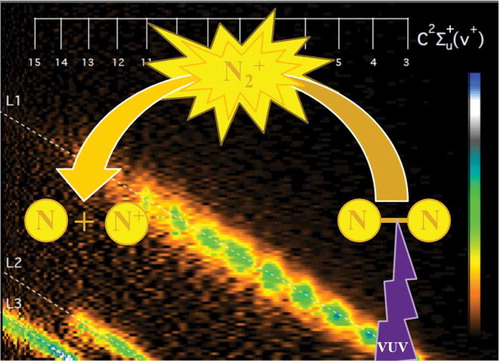
Figure 1. MRCI/aug-cc-pV5Z potential energy curves of the gerade (top) and ungerade (bottom) electronic states of N2+. The reference energy is taken as that of N2 (X1∑g+, v” = 0). The adiabatic ionization energy of N2 is taken from Ref [Citation74]. The lowest dissociation limit (L1 @ 24.2884 eV) is located as given in Ref [Citation56]. L2 (@ 26.1874 eV) and L3 (@ 26.6724 eV) were located using the excitation energies of N+ and N, respectively. The thick line corresponds to N2+ ground state PEC
![Figure 1. MRCI/aug-cc-pV5Z potential energy curves of the gerade (top) and ungerade (bottom) electronic states of N2+. The reference energy is taken as that of N2 (X1∑g+, v” = 0). The adiabatic ionization energy of N2 is taken from Ref [Citation74]. The lowest dissociation limit (L1 @ 24.2884 eV) is located as given in Ref [Citation56]. L2 (@ 26.1874 eV) and L3 (@ 26.6724 eV) were located using the excitation energies of N+ and N, respectively. The thick line corresponds to N2+ ground state PEC](/cms/asset/d656fbbd-9f98-4cb3-9729-eece18a04153/tapx_a_1831955_f0001_oc.jpg)
Figure 2. Adiabatic (left) and diabatic (right) PECs of the ungerade excited states of N2+ involved in the predissociation branching ratios calculations of the N2+(C2∑u+) state. The reference energy is taken as that of N2(X1∑g+, v” = 0). For obtaining the diabatic PECs from the adiabatic ones, we used the B – C radial coupling from Ref [Citation43]. in addition to the couplings presented in
![Figure 2. Adiabatic (left) and diabatic (right) PECs of the ungerade excited states of N2+ involved in the predissociation branching ratios calculations of the N2+(C2∑u+) state. The reference energy is taken as that of N2(X1∑g+, v” = 0). For obtaining the diabatic PECs from the adiabatic ones, we used the B – C radial coupling from Ref [Citation43]. in addition to the couplings presented in Figure 3](/cms/asset/fc77692b-b137-4cb2-b5f1-9abed51b1681/tapx_a_1831955_f0002_oc.jpg)
Table 1. Spectroscopic constants of the electronic states of N2+ investigated in the present work. We give the equilibrium distance ( in Å), vibrational constants (
,
,
, in cm−1) and the rotational constants (
,
, in cm−1). T0 (in eV) is the adiabatic excitation energy calculated as the difference between the energies of the minimum of the ground state and the minimum of the considered excited state including the zero point vibrational energy corrections
Figure 3. Radial couplings between the 2∑u+ states (in A) and those between the 4πu states (in B). In C), we give the transition dipole moments between the C2∑u+ state and some electronic-excited states of N2+. In D), we plot the spin-orbit couplings between the electronic states depicted in
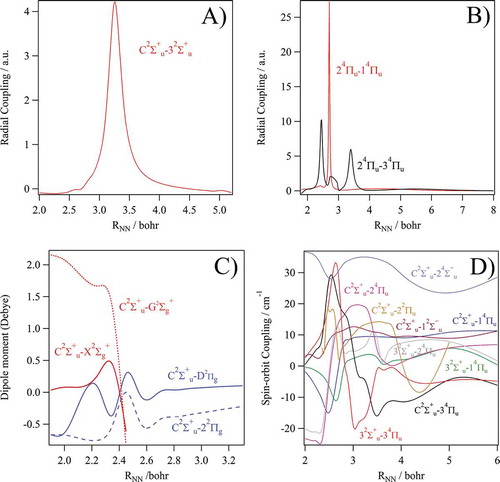
Table 2. Radiative (τradiative), predissociative (τpredissociative) and natural (τnatural) lifetimes of the N2+(C2∑u+, 0 ≤ v+ ≤ 15) vibrational levels. All values are in ns. and
correspond to the radiative lifetimes associated with the C2∑u+_X2∑g+ and C2∑u+_D2πg transitions.
is the global radiative lifetime computed as
=
+
.
,
and
correspond to the C state spin-orbit induced predissociation lifetimes by the 14πu, 24πu and 24∑−u states respectively.
is for the global predissociation lifetime computed as
=
+
+
. .
is the predissociation lifetime estimated by the time-dependent method and
is due to the coupling between the C and B states only . τnatural is deduced as
=
+
Figure 4. Intensity of dissociative ionization events yielding N+ fragments recorded at a photon energy of 27.2 eV, as a function of electron kinetic energy (Ele KE) and N+ kinetic energy. Diagonal white dashed lines point the three accessible dissociation limits, while the white vertical lines represent the expected position of the N2+(C2∑u+) vibrational levels from v+ = 3 until v+ =15, according to Yoshii et al. [Citation75]
![Figure 4. Intensity of dissociative ionization events yielding N+ fragments recorded at a photon energy of 27.2 eV, as a function of electron kinetic energy (Ele KE) and N+ kinetic energy. Diagonal white dashed lines point the three accessible dissociation limits, while the white vertical lines represent the expected position of the N2+(C2∑u+) vibrational levels from v+ = 3 until v+ =15, according to Yoshii et al. [Citation75]](/cms/asset/6025df02-174a-4301-bfb8-40065bfe5a2f/tapx_a_1831955_f0004_oc.jpg)
Figure 5. Kinetic energy release distributions of the N+ fragment generated from N2+ (C2∑u+) v+ =11 to 15, recorded at a fixed photon energy of 27.2 eV. The dashed diagonal lines show the three different dissociation limits available. For v+ =14 and v+ =15, the curves are also shown after multiplication by an order of magnitude to accentuate the weak dissociation to L2 and L1. The branching ratios to the three dissociation limits are provided for the five vibrational levels in
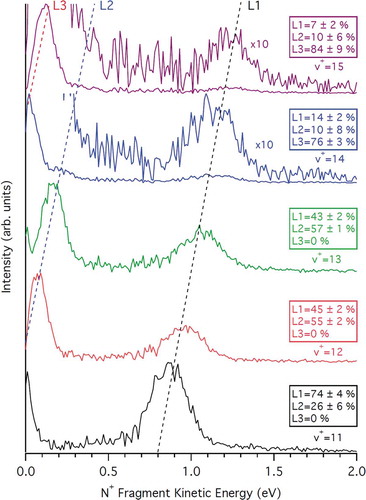
Figure 6. Number of dissociation events towards the three available limits, L1 (black), L2 (blue) and L3 (red), recorded at hv = 27.2 eV as a function of the electron kinetic energy. The relative intensity of the curves corresponds to the branching ratios to the three dissociation limits. The positions of the N2+(C2∑u+) vibrational levels from Yoshii et al. [Citation75] are marked in magenta, as well as four different progressions in gray S1(22Πg), S2(2∑u−), S3(2Δu) and S4(2Πu) from the same reference
![Figure 6. Number of dissociation events towards the three available limits, L1 (black), L2 (blue) and L3 (red), recorded at hv = 27.2 eV as a function of the electron kinetic energy. The relative intensity of the curves corresponds to the branching ratios to the three dissociation limits. The positions of the N2+(C2∑u+) vibrational levels from Yoshii et al. [Citation75] are marked in magenta, as well as four different progressions in gray S1(22Πg), S2(2∑u−), S3(2Δu) and S4(2Πu) from the same reference](/cms/asset/d843b6ca-18c2-452e-82f5-79738c91de66/tapx_a_1831955_f0006_oc.jpg)
Table 3. Experimental and calculated branching ratios (in %) for the N2+ (C2∑u+, v+) vibrational levels. The energies of the vibrational levels (Ev, in eV) are given with respect to N2 (X1∑g+, v” = 0). L1, L2 and L3 refer to the first, second, and third dissociation limits as specified in
Figure 7. Threshold photoelectron photoion coincidence (TPEPICO) curves obtained for N+ (red) and N2+ (black) by selecting only the photoionization events that correlate with the emission of a threshold electron. The threshold selection is achieved using the slow photoelectron method outlined by Poully et al. [Citation77] and the parameters are set to deliver a total resolution of 15 meV. The vertical-dashed line represents the first dissociation limit towards N+(3P) + N(4S). Positions of the N2+ (C2∑u+) 0 ≤ v+ ≤ 3 vibrational levels are from Yoshii et al. [Citation75]
![Figure 7. Threshold photoelectron photoion coincidence (TPEPICO) curves obtained for N+ (red) and N2+ (black) by selecting only the photoionization events that correlate with the emission of a threshold electron. The threshold selection is achieved using the slow photoelectron method outlined by Poully et al. [Citation77] and the parameters are set to deliver a total resolution of 15 meV. The vertical-dashed line represents the first dissociation limit towards N+(3P) + N(4S). Positions of the N2+ (C2∑u+) 0 ≤ v+ ≤ 3 vibrational levels are from Yoshii et al. [Citation75]](/cms/asset/db029612-1fa8-456e-83dc-0fe72fe18047/tapx_a_1831955_f0007_oc.jpg)
Figure 8. Photodissociation cross-sections of a Franck-Condon wave packet computed in three electronic basis sets. Panels (a) and (b): three 2∑u+, three 4Πu and one 4∑u− states; panels (c) and (d): three 2∑u+ states; panels (e) and (f): B2∑u+and C2∑u+ states only
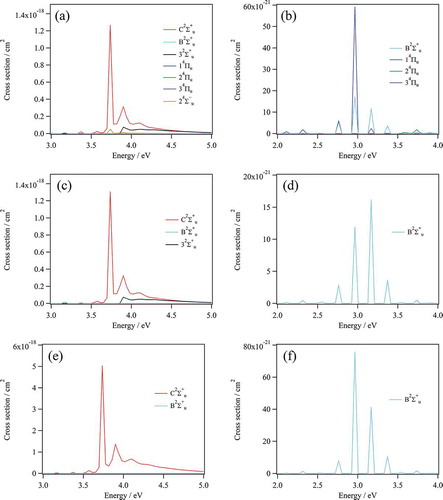
Figure 9. Time evolution of the wavepacket initially prepared in the v+ = 0, 4, 10, 11, 12, 13, 14 and 15 vibrational levels of the C2∑u+ state of N2+ populating the C2∑u+, B2∑u+, 32∑u+, 14Πu, 24Πu, 34Πu and 24∑u− states. These evolutions are confirmed by longer dynamics (not shown). For v+ = 15, the populations are almost those at t = 12 ps
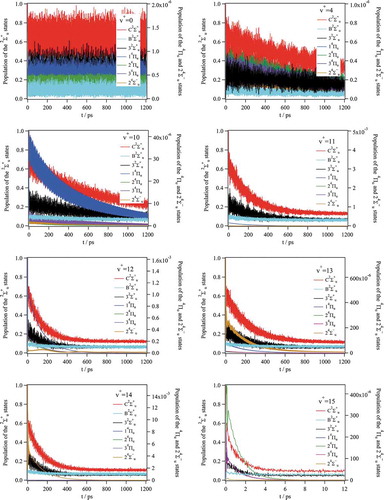
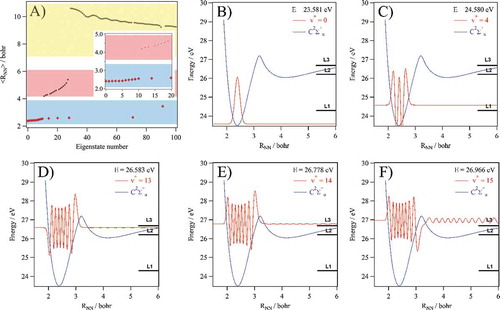
Figure 10. In A): Average position of the first 100 vibrational eigenstates of the C2∑u+ state with a discretization of the dissociation continuum. In the blue region, we give those located mainly in the inner potential well of the C state (i.e. v+ = 0–15). The v+ quantum number does not correspond to the eigenstate number for v+ > 10 but continues the series of eigenstates located in the inner well with an increasing number of nodes. The v+ = 0–15 levels are marked by red crosses. In the red region, those located in the outer potential well. In the yellow region, those delocalised in the continum (but artificially localized at long distance due to the finite grid). In the inset, we give an enlargement for the 20 first eigenstates where we can distinguish the v+ =0 – 12 eigenstates located in the inner potential well of the C state (red region). In B-F), we plot the vibrational wavefunctions of the N2+(C2∑u+) state for v+ = 0, 4, 13, 14 and 15, respectively. The energies of these levels with respect to the vibrationless N2 ground state are also given. See text for more details